/global/header/smart-buildings.svg)


/global/header/facility-management.svg)



/global/header/leisure.svg)







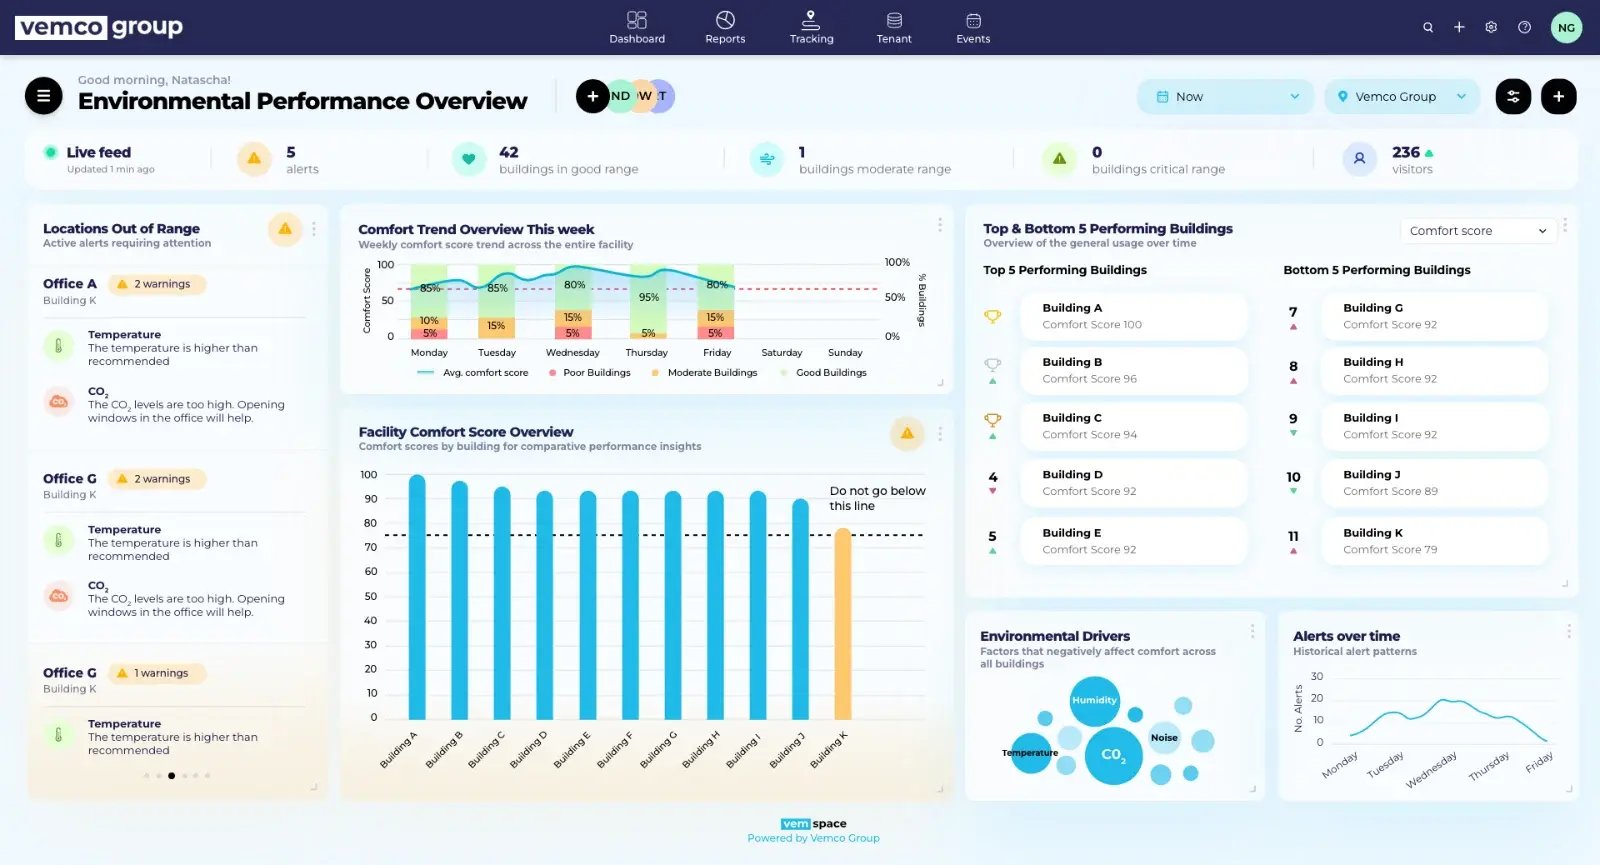
Vemcount and VemTenant
Shopping centre statistics in 2026 mean more than a visitor count at the main door. Landlords need footfall, tenant turnover and benchmarking together, so the centre is managed on sales per visitor and capture rate, not on a monthly traffic total.
The footfall side comes from Vemcount. Sensors at every entrance, on every floor and at escalators and car park links count visitors anonymously, and the platform turns the counts into trends per entrance, hour, day and season, with weather, holidays and opening hours separated from real changes in demand.
The revenue side comes from VemTenant. Tenants submit or update their revenue data in a simple web and mobile form, monthly or daily depending on the lease. A reporting status overview shows who has reported and who still needs a reminder, and as soon as the data is in, turnover statistics, tenant rankings and category benchmarks are ready for centre management and for the tenants themselves. Combined with footfall, every tenant gets a capture rate, a sales per visitor figure and a sales per square metre figure that can be compared across the centre and across the portfolio.
Vemco Group counts in more than 800 shopping centres, with over 55,000 installations in 98+ countries and more than 60 million people counted every day, built on 20+ years of people counting experience.
Mall Analytics: Seven Views of the Same Shopping Centre
Entrance & Floor Footfall
Tenant Revenue Reporting with VemTenant
Tenant Rankings & Turnover Statistics
Capture Rate & Zone Flow
Leasing & Asset Management
Marketing & Events
Portfolio Benchmarking & Reporting
A sensor at every entrance, on every floor and at escalators, lifts and car park links gives a complete picture of how people arrive and move through the centre. Vemcount shows footfall per entrance and per hour, compares this year with last, flags sensor outages and separates weather, holidays and opening hours from real changes in demand. Counting is anonymous and works with 3D and time-of-flight sensors from several manufacturers, so existing installations can be connected.
VemTenant replaces the spreadsheet and the chasing emails. Each tenant gets a login and submits or updates revenue data in a short web or mobile form, monthly or daily as the lease requires. Automatic reminders go to tenants who have not reported, the reporting status overview shows centre management exactly who is missing, and validation rules catch obvious errors before the figures reach the statistics. The result is a complete, comparable turnover dataset every period.
Once turnover is in, VemTenant calculates sales per visitor, sales per square metre and growth against last year for every tenant, and groups the results by category, floor and wing. The ranking report shows which tenants outperform their category and which fall behind, and the turnover statistics show how the centre as a whole is trending. Centre management uses it for leasing and marketing, and tenants see where they stand against the category average.
Capture rate is the share of people who pass a shop front and actually enter. Measured per unit, it shows whether a tenant converts the traffic the centre delivers or whether a good location is being wasted. Zone counting extends the same logic to wings, floors and food courts: how many visitors reach each area, how long they stay and where the flow breaks. Together they explain why two units with the same corridor traffic produce very different sales.
Footfall and turnover data change the leasing conversation. Percentage rent can be audited against reported turnover, renewals are negotiated on sales per square metre and capture rate instead of opinion, and tenant mix decisions are based on which categories draw traffic and which only benefit from it. Asset managers get a consistent, documented dataset for valuations, investor reporting and the annual business plan.
Every event, campaign week and late-night opening can be measured on the same basis: footfall against the comparable period, by entrance and by hour, and turnover uplift per tenant category once the revenue data is in. Marketing managers see whether an event brought new visitors or simply moved the weekend crowd, and opening hours decisions are made on the traffic curve rather than on habit.
Owners with several centres compare them on one screen: footfall per square metre, sales per visitor, capture rate and turnover growth, grouped by country, region or asset type, with time zones and local calendars handled automatically. The interface is available in 24 languages, scheduled reports go to centre managers and head office by email, and every metric is available through the API for Power BI, Tableau or the group data warehouse.
From Monthly Reporting to a Weekly Operating Rhythm
Most shopping centres still manage on a monthly footfall report and a quarterly turnover summary. The landlords that get the most out of Vemcount and VemTenant run a short routine on the same numbers every week:
- Monday footfall review: visitors per entrance and per floor against last week, last year and the portfolio average. Which entrances gained, which lost, and does the pattern match a campaign, a holiday, roadworks or the weather?
- Reporting status check: which tenants have submitted revenue data for the period and which need a reminder, so the turnover statistics are complete before the leasing meeting rather than three weeks after it.
- Ranking outliers: the tenants with the biggest change in sales per visitor or capture rate. A drop with stable corridor traffic points to the unit, not to the centre.
- Event and campaign readout: footfall uplift by entrance and hour, and turnover uplift by category, for anything that ran the previous week.
- Operations and opening hours: dwell time, zone occupancy and evening traffic used to adjust cleaning, security rosters and late-opening decisions.
Who Uses Shopping Center Statistics, and What They Get

Asset Managers
One documented dataset for the whole property: footfall per square metre, turnover per category, capture rate and growth against last year. Used for the business plan, valuations, investor reporting and the case for refurbishment or re-tenanting.


Centre Managers
The weekly operating picture: which entrances are up or down, which tenants have reported, where dwell time is falling and which zones are under-visited. Scheduled reports arrive before the Monday meeting, not after it.

Leasing Managers
Sales per square metre, sales per visitor and capture rate per unit turn renewals and new lettings into a data conversation. Percentage rent is audited against reported turnover, and the tenant mix is planned on which categories actually pull traffic.

Marketing Managers
Footfall and turnover uplift for every event and campaign week, by entrance, hour and category. Marketing shows what it brought in, and the marketing fund is allocated to activities that moved the numbers.

Tenants
Tenants report revenue in a short web or mobile form and get something back: their own footfall, capture rate and sales per visitor against the category average. A shared view of the numbers makes the landlord and tenant relationship easier on both sides.

Investors & Valuers
Verified footfall and turnover history for the asset, consistent across the portfolio and exportable for due diligence. The same metrics that run the centre support acquisition, refinancing and disposal decisions.

Operations & Security
Live occupancy per zone and floor, peak-hour traffic per entrance and evening dwell patterns inform cleaning schedules, security rosters, car park management and safe-capacity limits for events.




Content Hub





Blog
The Busiest Shopping Days of the Year: What Footfall Data Shows and How Stores Prepare
Learn More
Let’s Get in Touch!