/global/header/smart-buildings.svg)


/global/header/facility-management.svg)



/global/header/leisure.svg)






Vemcount
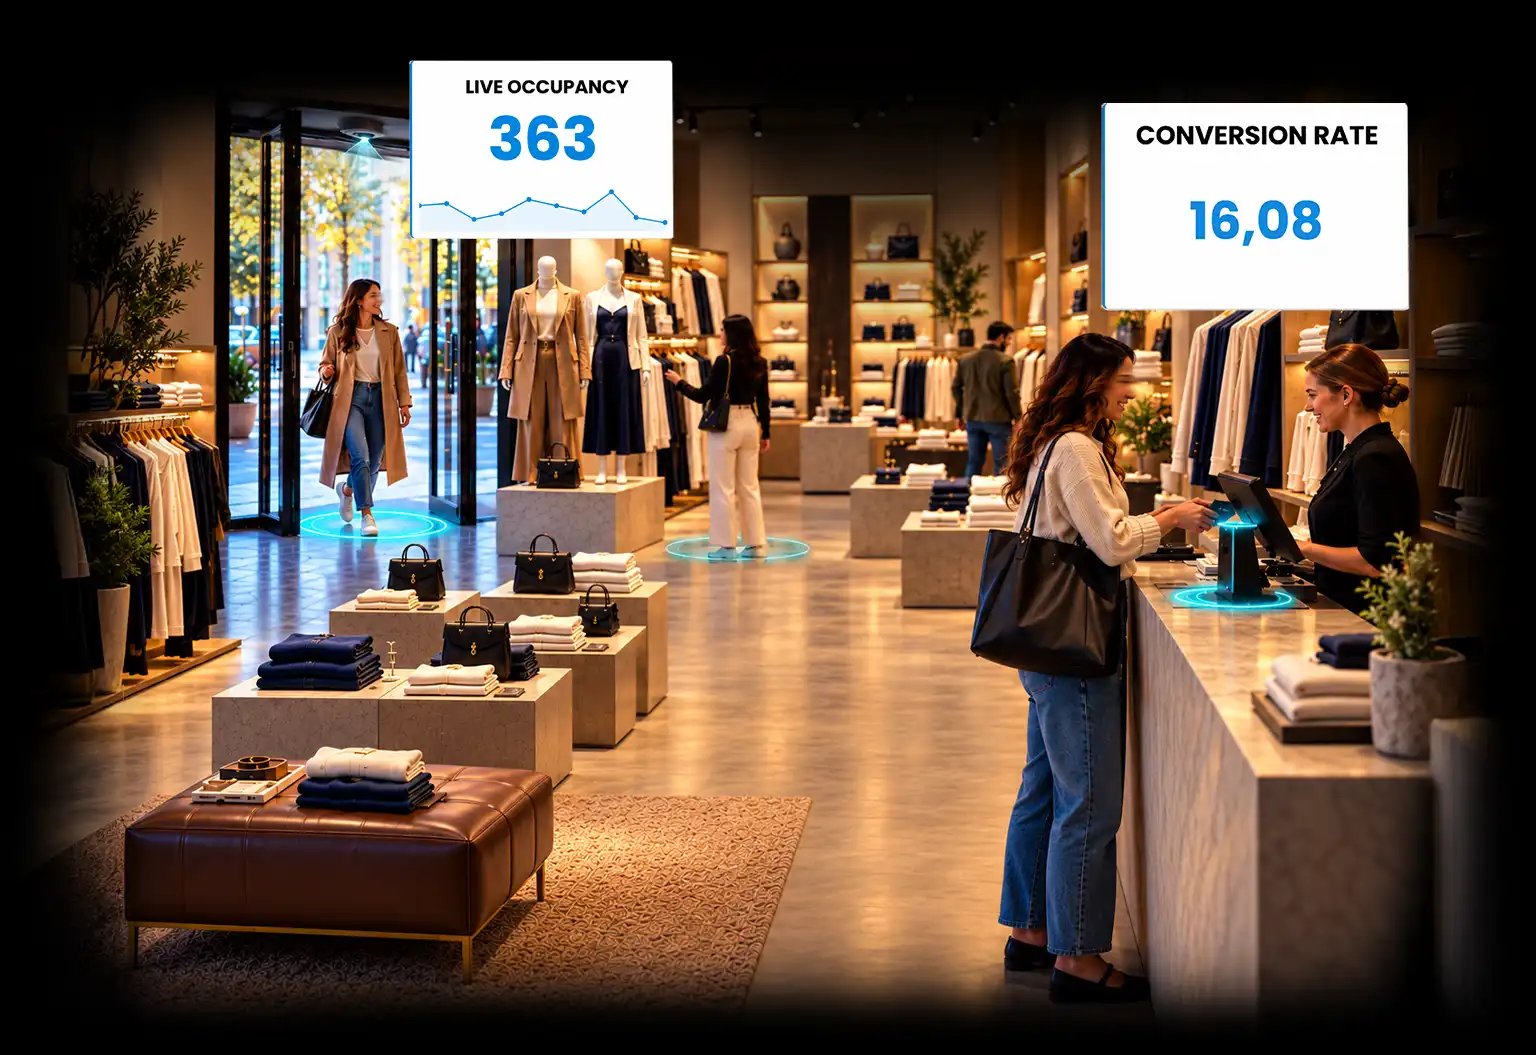
Retail analytics software in 2026 combines footfall, POS transactions, staffing and zone data in one view, so every store is judged on conversion and sales per visitor, not on turnover alone.
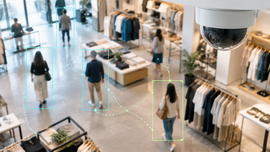
Counting people at the door is the starting point, not the answer. A traffic number on its own cannot tell you whether a store underperformed because fewer people came in or because fewer of them bought. The value appears when footfall sits next to transactions, staff hours and the zones shoppers actually visited.
Vemcount is the retail analytics platform behind more than 55,000 installations in 98+ countries, counting over 60 million people every day. It is hardware independent, so it works with the people counting sensors you already own or the ones we supply. Conversion rate is calculated automatically through 19 POS integrations, stores are benchmarked across regions and countries, the interface is available in 24 languages and every metric is available through the API.
In-Store Analytics: Seven Views of the Same Store
Footfall & Traffic Trends
Conversion Rate & Sales per Visitor
Staff Planning Against Traffic
Zone Analytics, Dwell Time & Heat Maps
Queue & Occupancy
Multi-Site Benchmarking & Rankings
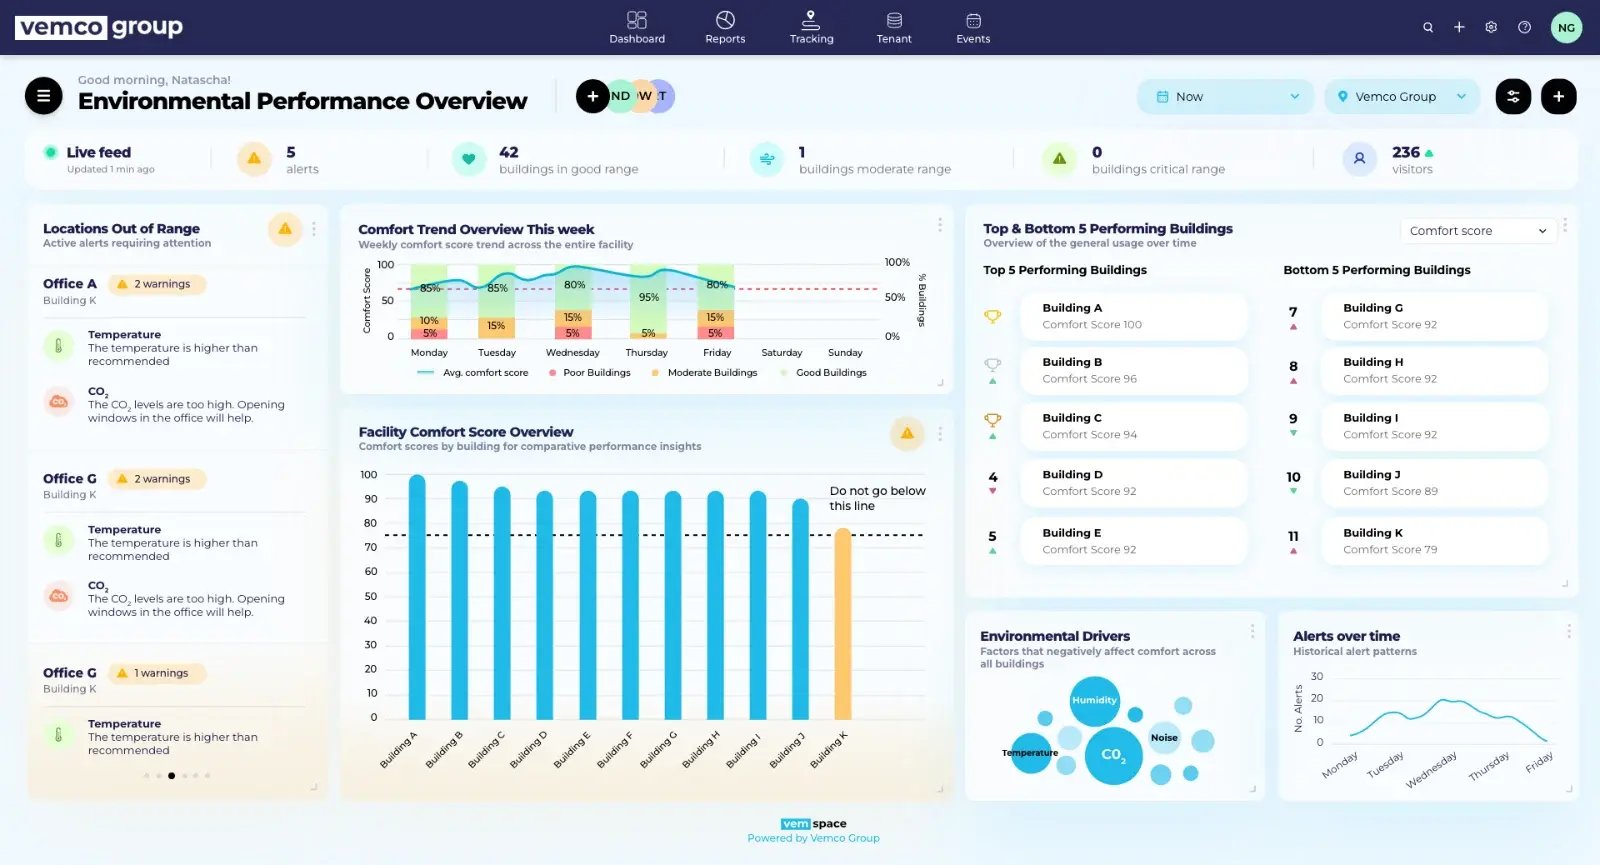
Dashboards, Reports & API
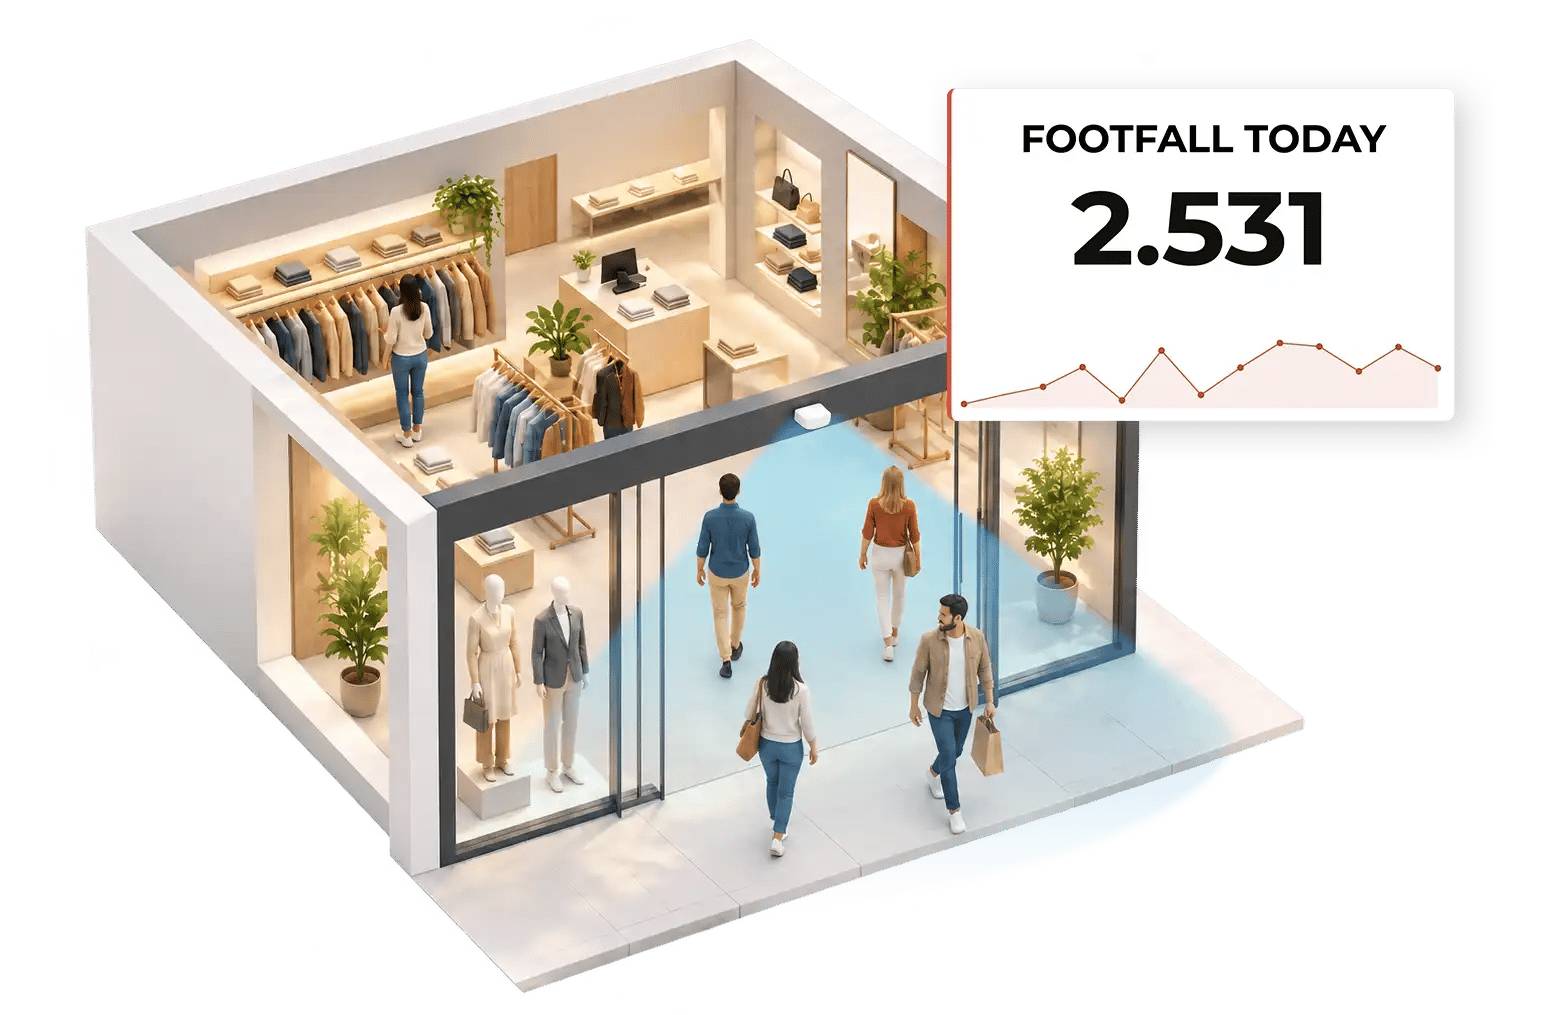
Accurate people counting per entrance, per store and per hour is the base layer of retail analytics. Vemcount shows traffic trends by day, week and season, compares this year with last and separates opening hours, weather and holidays from real changes in demand. Counting is anonymous and works with 3D and time-of-flight sensors from several manufacturers, so existing installations can be connected.
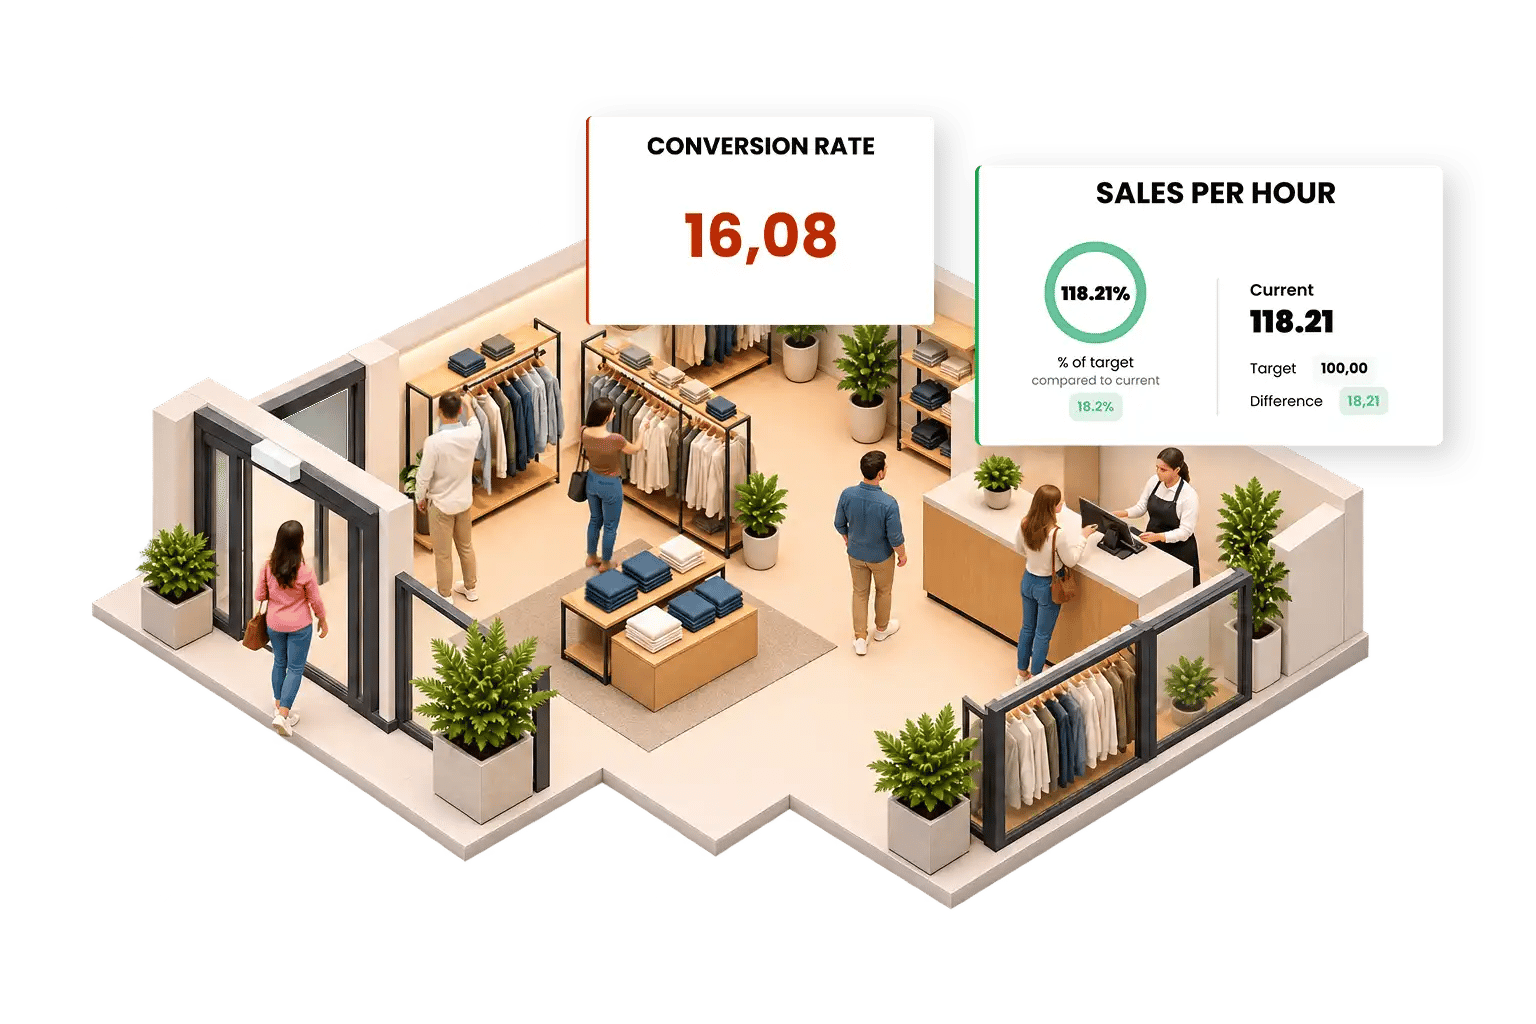
Vemcount pulls transactions from your POS system and divides them by visitors, so conversion rate, average transaction value and sales per visitor are calculated for every store and every hour without spreadsheets. Integrations include Shopify, Microsoft Dynamics 365 Business Central, Lightspeed Retail and 16 other POS systems. See the full list on the integrations page.
The staff to traffic ratio shows how many visitors each employee had to serve in a given hour. Put the rota on top of the footfall curve and you can see where peak hours are under covered, where quiet hours are over covered and how conversion moves when the ratio changes. Scheduled reports give store managers the numbers before they plan next week.
Zone counting extends analytics from the door to the sales floor. Measure how many shoppers reach each department, how long they stay and which displays stop them, and view the result as a heat map of the store. Combined with category sales, zone analytics shows whether a department sells because of demand or because of its position.
Live occupancy per store and per zone shows when a floor is crowded and when it is empty. Queue measurement at the tills tracks how many customers wait and for how long, and the conversion data shows what a long queue costs in lost sales. Alerts notify staff when a limit is reached, and the history supports decisions on opening hours and layout.
Retail chains rarely lack data; they lack comparable data. Vemcount ranks stores on footfall, conversion, sales per visitor and capture rate, groups them by region, format or manager and handles time zones for international chains. Store managers see their own store against the group average, and head office sees the whole estate on one screen.
Every metric is available in dashboards, in scheduled reports by email and through a documented REST API. Pull footfall and conversion into Power BI, Tableau or your own data warehouse, or push it into workforce management and marketing tools. The data stays yours and can be exported at any time.
From Data to Weekly Decisions
Retail analytics only pays off when it changes what happens in the store. The chains that get the most out of Vemcount run a short, fixed routine on the same numbers every week:
- Monday traffic review: footfall per store against last week, last year and the regional average. Which stores gained, which lost, and does the pattern match a campaign, a holiday or the weather?
- Conversion outliers: the five stores with the biggest drop or gain in conversion rate. A drop with stable traffic points to staffing, stock or service, not marketing.
- Staffing adjustments: compare the staff to traffic ratio by hour and move hours from quiet slots to under covered peaks before the next rota is published.
- Marketing attribution by campaign week: did the campaign bring more people in, or did it only lift basket size among people who were coming anyway? Footfall and conversion answer those two questions separately.
- Capture rate for window displays: the share of passers-by who entered, measured before and after a window change, so visual merchandising is judged on data rather than opinion.
Retail Analytics for Every Store Format

Fashion & Apparel
Conversion rate and capture rate are the numbers that matter. Measure how many passers-by the window pulls in, conversion per hour and dwell time per collection, and staff the floor when shoppers are actually there.


Grocery & Supermarkets
High traffic and thin margins reward small improvements. Track visitors per till, queue length and peak hours to open checkouts at the right moment and plan staffing by the traffic curve.

Electronics & Consumer Tech
Long consideration and high ticket sizes make every lost visitor expensive. Staff to traffic ratio and dwell time by product zone show whether advisors are available where the buying decision is made.
Furniture & Home
Fewer visitors, longer visits and delayed purchases. Footfall trends, zone dwell time and conversion measured over the campaign period show which showrooms and which displays drive orders.

Pharmacies
Waiting time at the counter decides customer satisfaction. Queue and occupancy data show when the prescription desk needs a second pharmacist and how self-service zones perform.

Department Stores
Several floors, many departments and shared entrances. Zone counting and floor by floor analytics show which departments pull traffic and which depend on their location.

Shopping Centres & Outlets
Footfall per entrance, dwell time and tenant benchmarking give centre management the numbers for leasing, marketing and operations. More than 800 malls already run on the platform.


Content Hub

Blog
Besucherströme messen: Methoden, Sensoren und Kennzahlen für Handel und Einkaufszentren
Learn More



Blog
The Busiest Shopping Days of the Year: What Footfall Data Shows and How Stores Prepare
Learn More
Let’s Get in Touch!