Smart Solutions, Smarter Malls
People Counting & Analytics for Shopping Malls
Discover intelligent solutions that take your mall's performance to new heights through precise people counting and strategic tenant revenue management.
What mall analytics actually measures
Shopping centre analytics combines three separate data layers: how many people entered the centre, how they moved through it, and what each tenant sold. Most operators have the first, guess at the second, and collect the third by email once a month.
Comparison
| LAYER | WHAT IT ANSWERS | HOW MOST CENTRES DO IT TODAY |
|---|---|---|
| Footfall | How many people entered the centre, by entrance, hour and day | Entrance counters, often ageing and rarely reconciled against each other |
| Movement | Which zones and levels people reach, how long they stay, which anchors pull traffic past inline units | Not measured. Inferred from where the queues look longest |
| Tenant revenue | What each store sold, ranked by category and by square metre | Collected by email or portal, chased manually, weeks late and frequently incomplete |
The value is not in any one layer. It is in dividing one by another: footfall against turnover gives conversion, turnover against floor area gives revenue per square metre, and both together are what a lease conversation actually turns on.
How to choose analytics for a shopping centre
A centre has requirements a single retail store does not: multiple entrances, multiple levels, dozens of tenants who each need their own view, and a reporting cycle that has to survive tenants who do not submit on time. These six criteria apply to any vendor, including us.
Does it reconcile multiple entrances
A centre with six entrances and one car park has six counts that have to agree. Systems built for single-door retail produce six numbers and leave the reconciliation to you.
How does the system handle a visitor who enters at one door and leaves by another?
Can tenants see their own data
Tenant-facing dashboards are what turn a landlord system into something tenants actually value. Check whether tenant access is included or a separate licence.
Can a tenant log in and see their own footfall and conversion without seeing their neighbours' numbers?
How tenant revenue gets in
This is the difference between a report that arrives on the 3rd and one that arrives on the 25th. Manual collection is where mall reporting actually fails.
Is turnover imported automatically, and what happens when a tenant does not report?
Zone and level granularity
Centre-wide footfall tells you almost nothing about whether the second floor is working. Ask what it costs to add zones later, not just what the initial deployment covers.
What does it cost to add a zone in year two, and does it need new hardware?
What happens to the data
Centres are public spaces and the privacy question is asked earlier and harder than in a single store. Ask whether any image leaves the sensor.
Does any image or video leave the device, and where is the data stored?
Total cost of ownership
Quotes are rarely comparable as issued. One vendor prices hardware and bills installation separately, another bundles both and charges more per site.
Sensors · installation · annual subscription · tenant licences · integration work · support over three years
What centre data is actually used for
Four decisions that most centres currently make on relationships and instinct, and that become arguable with numbers.
Lease negotiations backed by footfall
A unit's rent is a function of the traffic passing it. Showing a tenant their measured footfall, conversion rate and rank within their category turns a rent conversation into a data conversation.
Which categories are underperforming their space
Revenue per square metre by category, ranked. It is the number that tells you whether the fashion floor is a merchandising problem or a footfall problem.
Whether the event paid for itself
Footfall and tenant turnover on event days against comparable non-event days. Most centres run events on faith because nobody measures the counterfactual.
Which anchor is carrying the centre
Zone flow shows which anchors pull traffic past inline units and which absorb it. That changes both leasing strategy and where you place the next vacancy.
What the system does for a centre
Centre-wide footfall
Counts by entrance, hour and day, reconciled across all doors rather than reported separately.
Automated tenant revenue
Turnover imported directly rather than chased by email, so the monthly report does not depend on who replied.
Store ranking reports
Tenants ranked by turnover, by conversion and by revenue per square metre, within and across categories.
Missing revenue alerts
Flags tenants who have not reported, before the reporting deadline rather than after it.
Category segmentation
Performance grouped by tenant category, which is the level leasing decisions are actually made at.
Zone and level analytics
Which parts of the centre people reach, how long they stay, and which routes they take.
Event calendar
Events recorded against footfall and turnover, so the effect of each is measurable afterwards.
Tenant dashboards
Each tenant sees their own numbers and their category benchmark, without seeing named competitors.
Who uses centre analytics, and for what
A shopping centre is not one buyer. Six people look at the same data and need different things from it.
Centre manager
Daily footfall against target, live occupancy on peak trading days, and where congestion is forming.
Leasing
Footfall passing each unit, conversion by tenant, and category rankings to bring into rent reviews.
Marketing
Campaign and event effect on footfall and tenant turnover, measured against comparable periods.
Operations and security
Live occupancy against capacity limits, with alerts before a threshold is crossed.
Asset owner
Portfolio comparison on the same measures, so centres are ranked on evidence rather than on local reporting.
Tenants
Their own footfall, conversion and category benchmark, which is what makes the data a retention tool rather than a landlord tool.
What it connects to
Tenant POS and turnover reporting, property management systems, BI and building management, through VemFusion, plus more than 50 sensor models from third-party manufacturers.
| CATEGORY | INTEGRATIONS | WHY IT MATTERS FOR A CENTRE |
|---|---|---|
| Tenant POS and turnover | Removes the monthly chase and makes conversion by tenant possible | |
| Property management | Puts footfall and turnover next to lease and floor area data | |
| Business intelligence | Power BI | Centre performance reported alongside the rest of the portfolio |
| Building management | BMS/BAS systems | Occupancy drives HVAC and lighting across large floor areas |
| Sensor manufacturers | 50+ models from the major manufacturers | Existing entrance counters can often be reused |
Is footfall counting in a public centre GDPR compliant?
Yes, when the system stores no images. Sensors process what they see on the device and output counts only. No video or still images are recorded, transmitted or stored, so visitors are never identifiable and there is no personal data to process
Comparison
| QUESTION YOUR DPO WILL ASK | ANSWER |
|---|---|
| Is any video or image stored? | No. Counts only. |
| Are visitors tracked between visits? | No. There is no persistent identifier. |
| Can tenants see data about individuals? | No. Tenant views are aggregated counts. |
| Where is the data hosted? | AWS with 99.9% uptime. Region confirmed at contract |
Installation and rollout
Vemco Group installs with its own teams rather than subcontracting, in 98+ countries. A centre rollout is phased by entrance and then by zone, so reporting starts before the full deployment is finished.
Comparison
| STAGE | WHAT HAPPENS | WHAT YOU PROVIDE |
|---|---|---|
| 1. Site survey | Entrances, levels and zones mapped, sensor count confirmed per area | Floor plans and access at trading hours |
| 2. Entrance phase | Entrance counting live and reconciled across doors | Power and network at mounting points |
| 3. Tenant onboarding | Turnover reporting connected, tenant dashboards issued | Tenant list and contact for each unit |
| 4. Zone phase | Levels and zones added, movement analytics live | Sign-off on zone definitions |
| 5. Handover | Dashboards built per role, teams trained | A list of who needs each view |
See it on your own centre plan
A 30 minute call. We use your entrances, your levels and your tenant mix, not a canned demo.
- We map your entrances and zones and tell you what each needs
- You see tenant ranking, conversion and revenue per square metre in the dashboard
- We answer the accuracy, GDPR and tenant-reporting questions directly
- You leave knowing what a phased rollout would look like for your centre
Overcome Your Mall Challenges
Attract New Tenants
Create a mall of experiences with accurate footfall data that lets you attract your dream tenants.
Stay Resource-Effective
Know exactly when and where resources and staff are needed, so these never go to waste.
Improve Tenant Strategies
Collect turnover and performance data from your tenants to improve your mall and tenant strategies.
Enhance Mall Layout
Discover the popular zones of your mall to optimize the layout and strategically place anchor stores.
Malls
Malls serve as vibrant hubs where consumers gather to shop, dine, and engage in leisure activities. In this competitive landscape, malls face numerous challenges such as optimizing layout, enhancing tenant performance, and maximizing revenue.
This is where people counting and tenant revenue management come into play.
Discover Our Products Specially Designed to Help Malls
A Solution to Every Problem
Luksusbaby A/S
Problem
Luksusbaby wanted to view real-time, accurate KPIs regarding their physical stores, such as hit and conversion rates, for improved decision-making.
Solution
Our solution helped Luksusbaby take action based on facts rather than intuition while discovering the age of their incoming visitors for accurate conversion rate data.
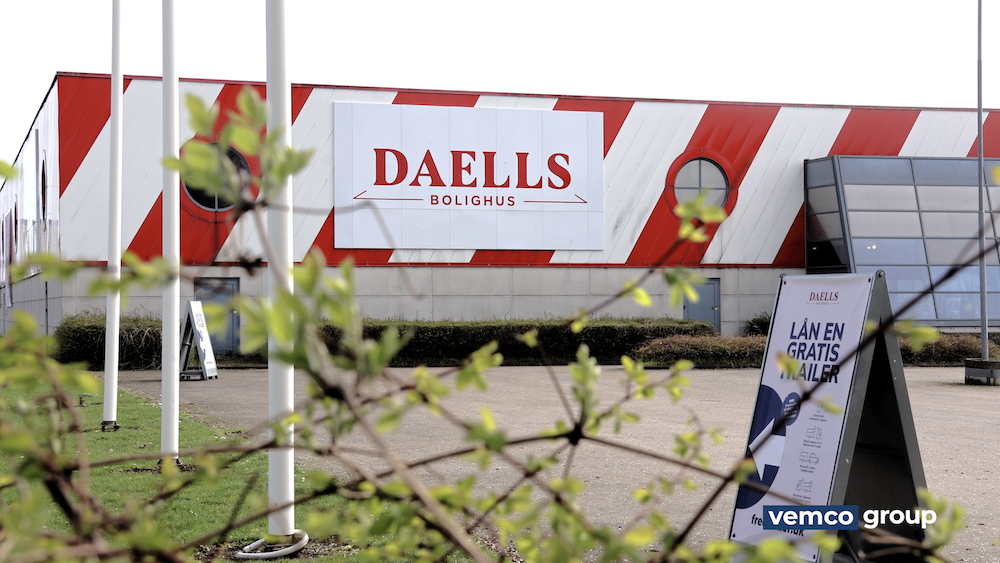
Daells Bolighus
Problem
Daells Bolighus struggled to keep up with the changing market and had been in an economic deficit for 16 years. The main problems were old-fashioned marketing strategy and a lack of insight into customer data.
Solution
Vemco Group installed people counters in both Daells Bolighus stores and integrated sales and visitor data from the physical stores with online data from their website, allowing them to view and compare data across locations.
Magasin
Problem
Magasin had an outdated, unreliable people counting solution and wanted a hosted solution, exporting data into a central BI system to give them insight into customer behavior in all their department stores.
Solution
We delivered an accurate, up-to-date people counting solution to Magasin, which allowed them to reduce operational costs by outsourcing their customer data to us.
Odense Municipality
Problem
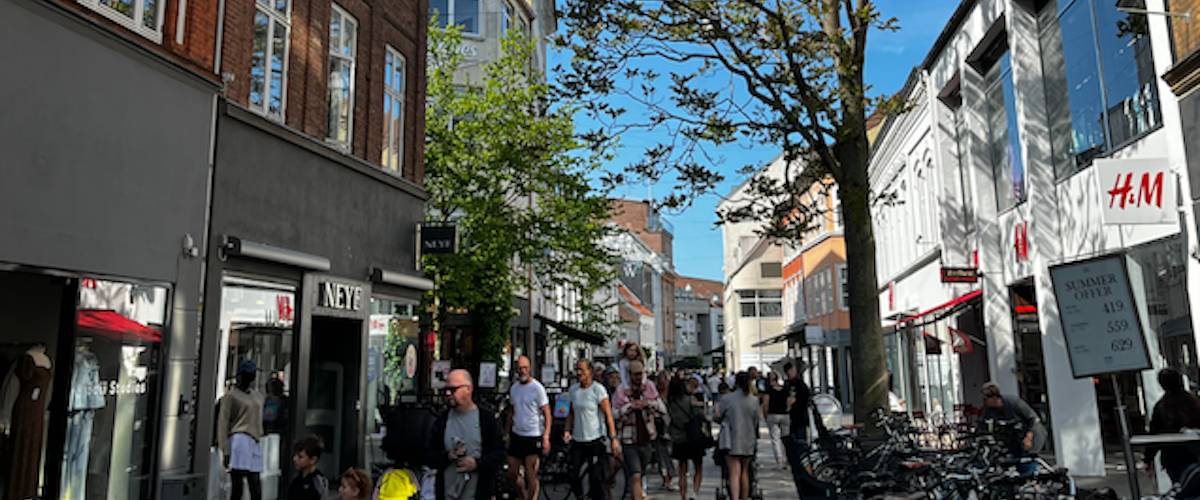
Odense Municipality wanted to access insight into how the citizens and visitors of Odense use the city and act on these insights based on factual decision-making rather than intuition.
Solution
To measure how the citizens and visitors of Odense use the shopping street, we cover all relevant entrances and exits with weather-resistant sensors that cover heights up to 20 meters.
You Are Only as Good as Your Customers Say

Katrine Velter
Senior Analyst
Danske Shoppingcentre
We own 17 shopping malls in Denmark, and Vemtenant handles our revenue reports from more than 1,000 stores. The system keeps track of missing reports, automatic reminders and reports, and user management. Credibility and transparency between our malls and the tenants were the most challenging issue, which is now solved.

Ivalu Jensen Skovgaard
Business Developer
Skechers
Comfort is key, and Vemco's footfall analytics help us understand customer behavior, so we are able to give our customers the best and most comfortable experience.

Jacob Høffer Larsen
Project Manager
Smart City Odense
We have been satisfied with our collaboration with Vemco Group, which has shown us that it is possible to reliably and professionally monitor pedestrians on our shopping street. We see a great potential in developing and running our city better based on the insights that Vemco Group has given us.

Janni Baslund Dam
Mall Manager
BROEN Shopping
We use Vemcount to measure the traffic at our entrances, so we get an idea of where the customers come from and when the number of visitors peaks during a day, week, month or year. This gives us, among other things, a tool for planning our marketing and activity calendar wh subsequently evaluating these activities.

Henrik Wieben
Country Manager
HiFi Klubben Denmark
Over the years, we have tested a handful of different people counting solutions, which unfortunately have disappointed us at every turn. Finally, with help from Vemco Group, we have found the right solution. A valid and good quality solution ensuring that we can optimize our business and measure the performance of our stores.

Lasse L. Mohrsen
Loss Prevention Manager
Magasin du Nord
We wanted a central solution that could cover all of our department stores in Denmark. We wanted the same system and a hosted solution but managed from one place. It was also a requirement from the beginning that the solution was able to count very accurately. And Vemcount has worked perfectly.

Ditte Nedergaard Pedersen
Regional Manager
Luksusbaby A/S
We wanted people counters in our physical stores so that we could access data and KPIs, such as conversion rates, to help us make action plans that improve the sales process. And Vemco came as a natural solution to this. We have received amazing support and have nothing but praise on our end.

Bjarke Bendix Cloos
Director
Jorcks Ejendomsselskab
The most important features for us have been the ability to accurately count how many people pass through both entrances of Jorck’s Passage during the day, as well as the system's operational stability so that we do not have to spend time on downtime. I asked my acquaintances in the mall industry, and they said that Vemco is the provider to use. That's why we chose Vemco.

Nedim Jukic
Retail Executive Assistant
Planika
By implementing Vemco Group's people counting solution, we aim to optimize our staffing, improve conversion rates, enhance store layout, and evaluate the effectiveness of our marketing efforts. This positions Planika for success in delivering exceptional customer experiences and driving business growth.

Jacob Falkenby
CEO
Fredericia Sports Centre
While browsing through the different kinds of people counters on the market, it became clear that the Vemco solution was the one, which suited us best. Partly, because of the sensor technology they offer, but also since they were able to deliver vast amounts of data, including accurate live data.

Brian Seemann Broe
CEO
Daells Bolighus
I was a bit cheeky to ask Vemco if it was possible to merge sales data from our online shop with data from our physical stores, and they provided a unique solution. Today, we have an absolutely fantastic tool - I can see how many visitors we have, I can see our turnover per hour, and this way, I can measure the impact of every single penny we invest in our marketing.

Keith Mafi
Senior Digital Portfolio Manager
Swedish Match (North Europe AB)
Working with Vemco Group has been an excellent experience. Their people counting solution provides us with accurate in-and-out data, which is essential for our direct retail operations. Precision and quality are critical to us, and Vemco Group consistently delivers both. Their team is not only professional but also incredibly supportive, always ready to assist us whenever we need it. We couldn't be more satisfied with our solution, which is tailored to fit our needs.

Alice Jansson
Store Manager
SmartaSaker
We contacted Vemco Group because we felt that it looked simple, it seemed to fit our needs, and it simply felt like a reliable solution. Our biggest challenge was that we had no idea what our conversion rate looked like. We used to rely on our gut feeling, and that's not a very data-driven approach. Additionally, we couldn’t figure out why certain things stood out in sales, why we had fewer visitors at certain times, and so on. Now we can see it very easily.

Saad Elkoli
IT Strategist & Object Manager
Haninge Municipality
Vemco Group's solution has given us insight into the usage of our facilities and provided us with better, more accurate data, enabling us to make data-driven decisions and simplify the overview of available data. The simplicity of being able to access precise data, which our operations and management team need to properly resource plan and schedule resources, is key.
Let's Connect