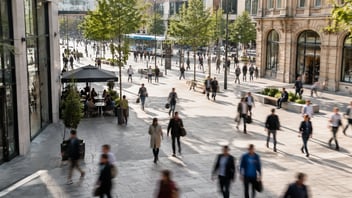









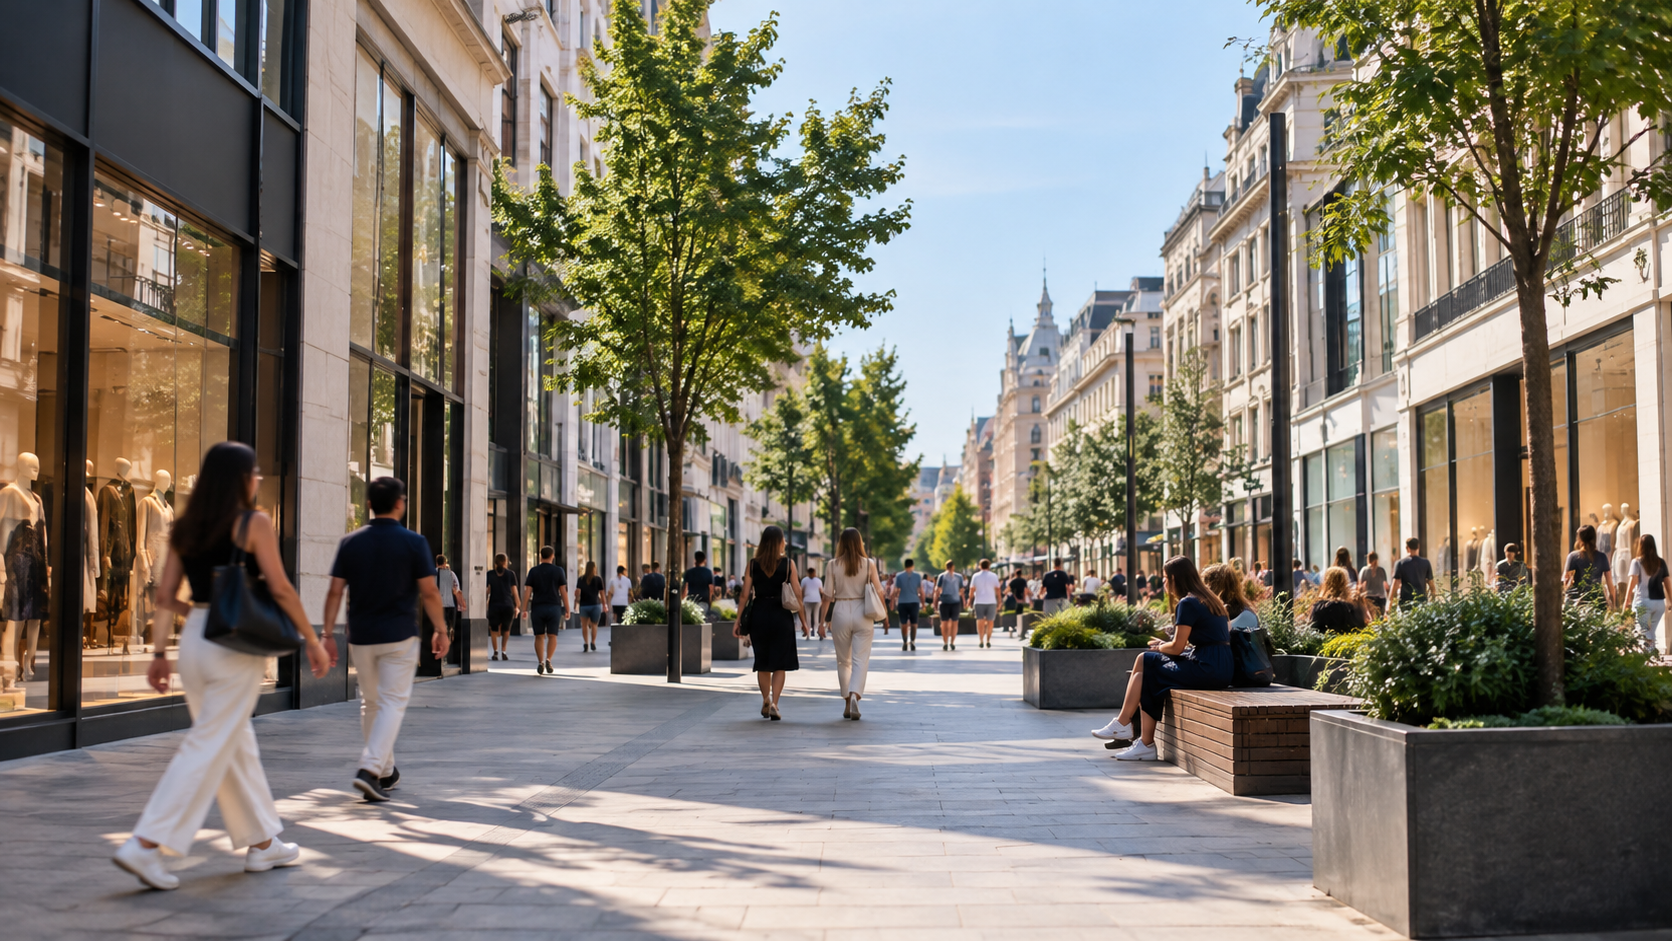
The most useful number from the first traffic-free week on Oxford Street is not the 16 percent rise in footfall. It is the gap between that figure and the 28 percent rise in spending. More people came, and the people who came spent more per head. That gap is what retailers on a pedestrianised street should be watching, because it tells you whether a street change is bringing in shoppers or just passers-by.
What happened on Oxford Street in week one
Since 26 October 2026, almost 1 km of Oxford Street between Orchard Street and Great Portland Street has been closed to traffic. According to figures from City Hall and the Oxford Street Development Corporation, reported by BBC News on 9 November 2026, footfall in the pedestrianised section rose 16 percent in the first week compared with the same week of 2025. International visitor numbers rose 42 percent year on year, and visits to the wider Oxford Street area after 6 pm rose 19 percent.
The spending data came from Adyen payment records. Spending at participating Oxford Street stores rose 28 percent, from about GBP 2.9 million to GBP 3.7 million, and in-store transactions rose 19 percent. Transport for London recorded more entries and exits at Oxford Circus and Bond Street stations, and TfL street sensors recorded footfall outside Bond Street station up to 46 percent above the average weekday count measured between 7 September and 16 October 2026. Market Halls on Oxford Street reported footfall up 29 percent and sales up 25 percent week on week, as Public Sector Executive noted on 10 November 2026.
Why the critics have a point, and why it does not settle anything yet
The first traffic-free week was school half term. The Marylebone Association has made that point, and it has also flagged that some bus journeys now take seven to nine minutes longer. BBC London calls the result a promising start but early days. Both positions are reasonable. A half-term week in central London always carries more families and more tourists, so a year-on-year comparison against the same week in 2025 controls for that, but it does not control for novelty. People came to see a car-free Oxford Street. Some of them will not come back.
The completed project is expected to cost GBP 150 million. At that scale, a single week of oxford street footfall data is a signal, not a verdict. The question for planners is what the same metrics look like in week ten.
How to separate a honeymoon week from a lasting change
Pedestrian zones are judged on measured footfall, dwell time and spending, not on impressions. The Oxford Street figures hold up because they come from three independent sources that point the same way: street sensors, station counts and payment data, each compared with the same week a year earlier. Any city, business improvement district or shopping street can run the same pedestrian zone footfall measurement with anonymous people counting sensors at street entrances and store doors.
The practical rules we apply when a client wants to evidence a street change:
- Install counters before the change, not after. A baseline of at least a few weeks, as TfL did with its 7 September to 16 October weekday average, is what makes the post-change figure meaningful.
- Read by hour and by weekday, not by week. The after-6 pm figure on Oxford Street matters because evening trade is what justifies longer opening hours and later staffing.
- Keep reading for at least eight to twelve weeks. That is roughly the window in which curiosity visits fade and underlying demand becomes visible.
- Compare against the same period a year earlier and against a control street nearby that did not change.
One observation from implementation: the hardest part of street-level footfall measurement is usually the entrances, not the technology. A pedestrianised street has side-street inflows that nobody counts because the brief focused on the main axis. If you only count the two ends, you will understate the total and misread where people enter. Map every entry point before sensors go in.
What retailers on the street should do with the data
A 16 percent rise in street footfall does not land evenly on every door. Retailers who count their own store entrances can compare store footfall with sales to see conversion, and plan staffing by hour. If the street is up 16 percent but your door is flat, the problem is your frontage or your offer, not the pedestrianisation. If your door is up but conversion has dropped, you have more browsers and the same number of buyers, and that is a staffing and merchandising question rather than a marketing one.
Vemco has worked on this kind of high street footfall question for 20+ years, with 55,000+ installations across 98+ countries. VemCount people counting software brings door counts, street counts and sales data into one view, by hour and by weekday, which is exactly the comparison the Oxford Street data invites. Our sensors are anonymous and store no images of identifiable people, which matters when the counting point is a public street. For the broader national picture, see our people counting overview, and for how councils and BIDs use the same approach, our smart cities page.
Frequently asked questions
How is footfall measured on a pedestrianised street? Usually with anonymous people counting sensors mounted at street entrances, side-street inflows and store doors, supported by station entry and exit counts and payment data. The counts are compared against a pre-change baseline and the same period a year earlier. Counting accuracy on well-sited sensors is contractually a minimum of 96 percent, typically 98 to 99 percent when lighting, layout and visitor behaviour allow.
Why did footfall and spending rise after the Oxford Street traffic ban? The published data shows more people on the street, notably more international visitors and more evening visits, alongside a 28 percent rise in spending at participating stores. The first week coincided with school half term and some novelty effect, so the size of the lasting change is not yet known.
How can a city or BID prove the effect of a pedestrian zone? Count before the change, count every entry point, read by hour and weekday, and keep reading for at least eight to twelve weeks. Compare against the same weeks a year earlier and against a nearby control street, and pair footfall with dwell time and spending.
How do retailers on a pedestrian street use footfall data? They compare their own door count with the street count to see what share of passing traffic they capture, then compare door count with transactions to track conversion. Hourly data then drives staffing, particularly for evening trade after a pedestrianisation.
If you manage a street, a BID or a store that is about to go traffic-free, or already has, book a demo and we will show you how to set up the before and after comparison that will tell you, in week twelve, whether your own version of Oxford Street has held.