/global/header/smart-buildings.svg)


/global/header/facility-management.svg)






/global/header/leisure.svg)






Pharmacies are the only retail format where a large share of visitors is contractually obliged to show up. Prescriptions guarantee traffic in a way no fashion retailer or grocer could dream of. And that is precisely why footfall, on its own, is the least informative metric a pharmacy chain can track. If 70% of your visitors would have come anyway, counting them tells you almost nothing about the performance of the one part of the store where you actually compete for money: the front-of-store.
OTC medication, vitamins, skincare, seasonal categories — this is where margin lives, and this is where most pharmacy analytics programmes are flying blind. A door counter will tell you 1,200 people entered on Tuesday. It will not tell you that 800 of them walked a straight line from the entrance to the dispensing counter, waited eleven minutes, stared at their phones, and left without passing a single promotional bay. Footfall says how many came. It says nothing about what they noticed, where they lingered, or whether their waiting time ever converted into browsing.
The waiting queue is your most under-measured asset
Every pharmacy operator knows the queue exists. Very few can quantify what happens during it. Waiting customers are a captive audience with disposable time — retail's rarest commodity — yet in most stores that time evaporates. Zone analytics, dwell time measurement and heatmaps answer the questions that matter here: which zones do waiting customers actually visit while their prescription is prepared? Do they drift toward skincare, or do they cluster near the counter and block the aisle for everyone else? Does a queue longer than five minutes increase browsing or trigger walkouts before the prescription is even collected?
One pattern implementers see repeatedly: the categories placed closest to the dispensing counter are often the ones pharmacists find convenient to restock, not the ones waiting customers are inclined to buy. Heatmap data frequently reveals a "dead cone" directly in front of the counter — customers standing in it face the pharmacist, not the shelves — while the highest-dwell impulse zone sits slightly off-axis, at the point where people step aside after taking a queue ticket. Merchandising into that off-axis zone, rather than the counter face itself, is one of the cheapest layout wins available, and you will never find it without zone-level data.
Separate the traffic you earned from the traffic you inherited
Category managers evaluating a new vitamin fixture or a skincare brand block need a denominator that reflects reality. Dividing category sales by total store footfall punishes the front-of-store for prescription traffic that never intended to shop. The more useful ratios are:
- Zone capture rate — what percentage of total visitors entered the OTC, vitamin or skincare zone at all. This is your merchandising reach.
- Dwell-to-purchase ratio — of those who lingered past a meaningful threshold (typically 20–30 seconds in a category bay), how many bought. This isolates assortment and pricing problems from visibility problems.
- Wait-time browsing conversion — the share of prescription customers who visited at least one front-of-store zone before or after collecting. This is the metric that tells you whether your captive audience is actually being monetised.
These three numbers change conversations at head office. A skincare category with low sales but a high dwell-to-purchase ratio has a traffic problem, not a range problem — fix placement or signage, not the assortment. The reverse pattern means people are finding the category and rejecting it, which points squarely at price architecture or brand mix. Footfall alone cannot distinguish between the two, and getting the diagnosis wrong wastes a planogram cycle.
Why measurement quality decides whether any of this works
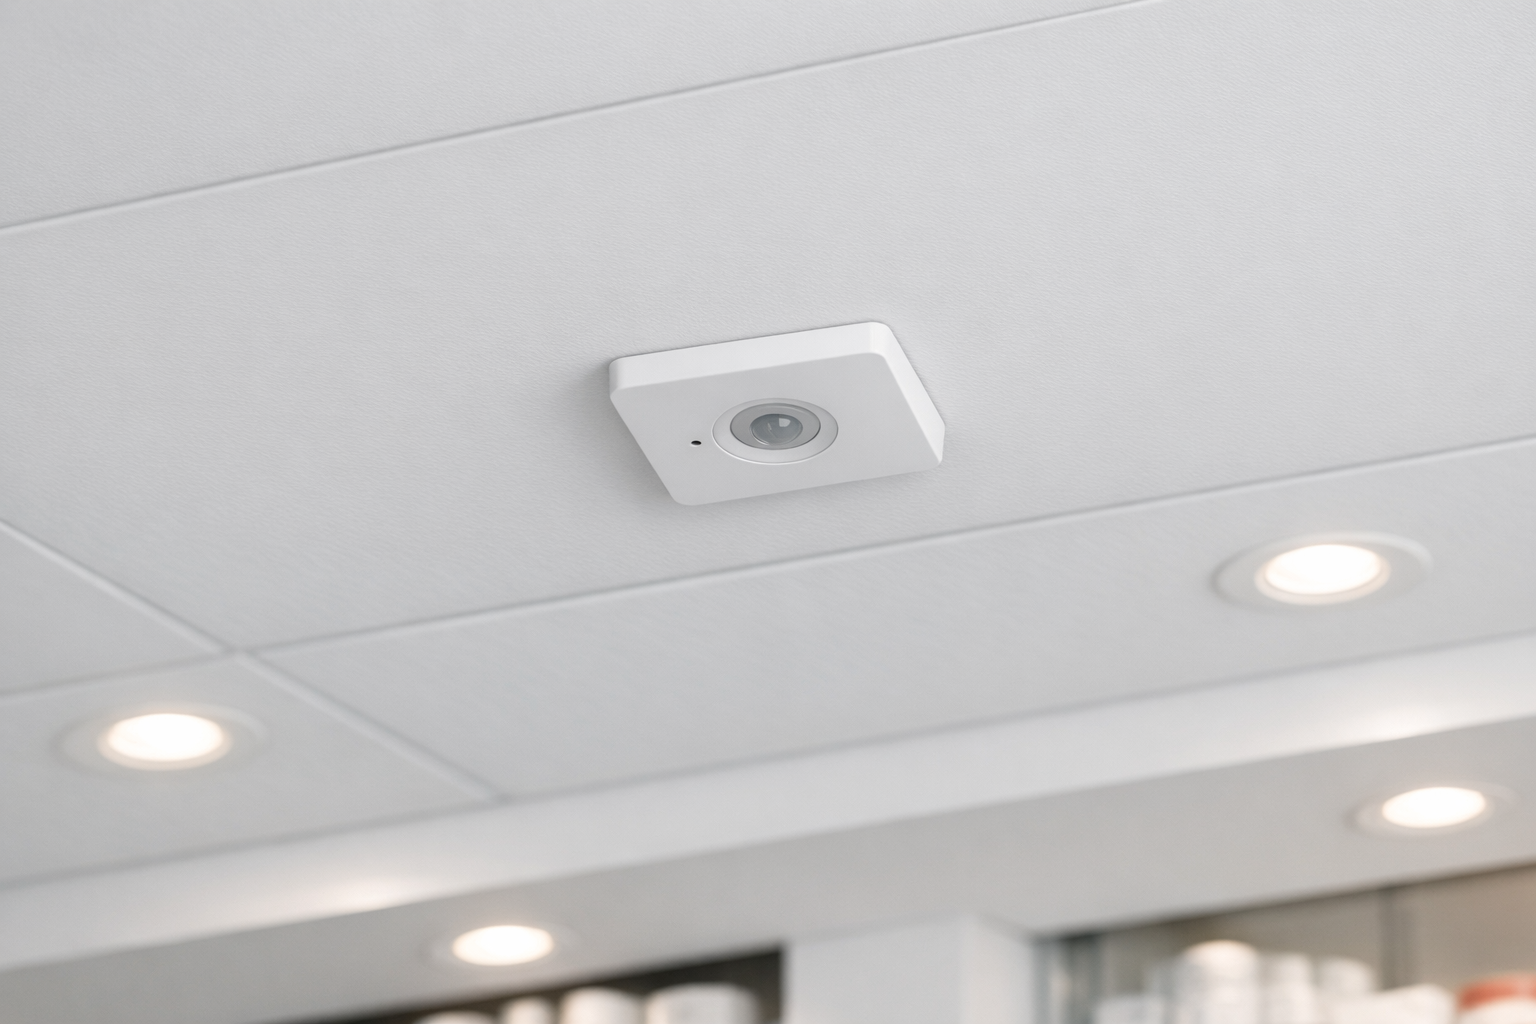
Pharmacies are hostile environments for cheap sensors. Stores are often small, ceilings low, entrances shared with shopping centres, and staff cross the counting line dozens of times an hour. If your baseline count is off by 10–15%, every downstream ratio — capture rate, conversion, dwell benchmarks across the chain — is quietly corrupted, and store managers will (rightly) stop trusting the dashboards. This is where the choice of analytics partner matters more than the choice of dashboard colour scheme.
Vemco Group, founded in Denmark in 2005, works sensor-agnostic across Xovis, Milesight, Elsys, Hikvision, Axis and Irisys hardware — relevant for pharmacy chains because store footprints vary wildly and no single sensor suits both a 40 m² high-street unit and a large drugstore format. The platform counts more than 60 million people every day across 55,000+ installations in 98+ countries, with a contractual minimum of 96% counting accuracy — in practice typically 98–99% when lighting, layout and visitor behaviour allow. That contractual floor matters: it is the difference between accuracy as a sales claim and accuracy as an obligation. Data is hosted on AWS in EU-Frankfurt with roughly two-second latency, and counting is fully anonymous and GDPR-compliant — a non-trivial point in a healthcare-adjacent setting where any suggestion of identifying patients is a reputational hazard.
What this looks like in practice across a chain
The operational value compounds when zone data is compared across locations. Two stores with identical footfall and identical assortments can show a 2x difference in vitamin-zone capture rate — usually traceable to queue geometry, fixture height blocking sightlines from the ticket dispenser, or simply which direction customers face while waiting. Operations teams can then treat the high-performing layout as a template and roll it out with evidence rather than instinct. Staffing decisions sharpen too: near-real-time data with roughly two-second latency lets managers see queue build-up as it forms, not in yesterday's report, and shift a second pharmacist to the counter before waiting time crosses the threshold where browsing turns into irritation.
Seasonal planning gains a feedback loop as well. Allergy season, cold-and-flu displays, sun care in early summer — pharmacies rebuild their front-of-store constantly, yet most chains judge these rebuilds on sales alone. Heatmaps before and after a reset show whether the new layout actually pulled traffic deeper into the store or merely rearranged where the same shoppers stood. When a seasonal end-cap generates dwell but no lift, you know within days rather than at the end of the season.
The guaranteed traffic that prescriptions deliver is a privilege no other retailer enjoys. Treating it as a headline number to celebrate, rather than raw material to convert, leaves the most profitable square metres in the store unmanaged. The chains pulling ahead are the ones measuring what happens between the door and the dispensing counter — and acting on it store by store.
Ready to see what your prescription traffic does before it reaches the counter? Talk to Vemco Group about zone analytics, dwell time and heatmapping configured for pharmacy formats — from compact high-street units to full drugstore layouts. Contact us here and we will walk you through what front-of-store conversion data looks like for a chain your size.