/global/header/smart-buildings.svg)


/global/header/facility-management.svg)






/global/header/leisure.svg)






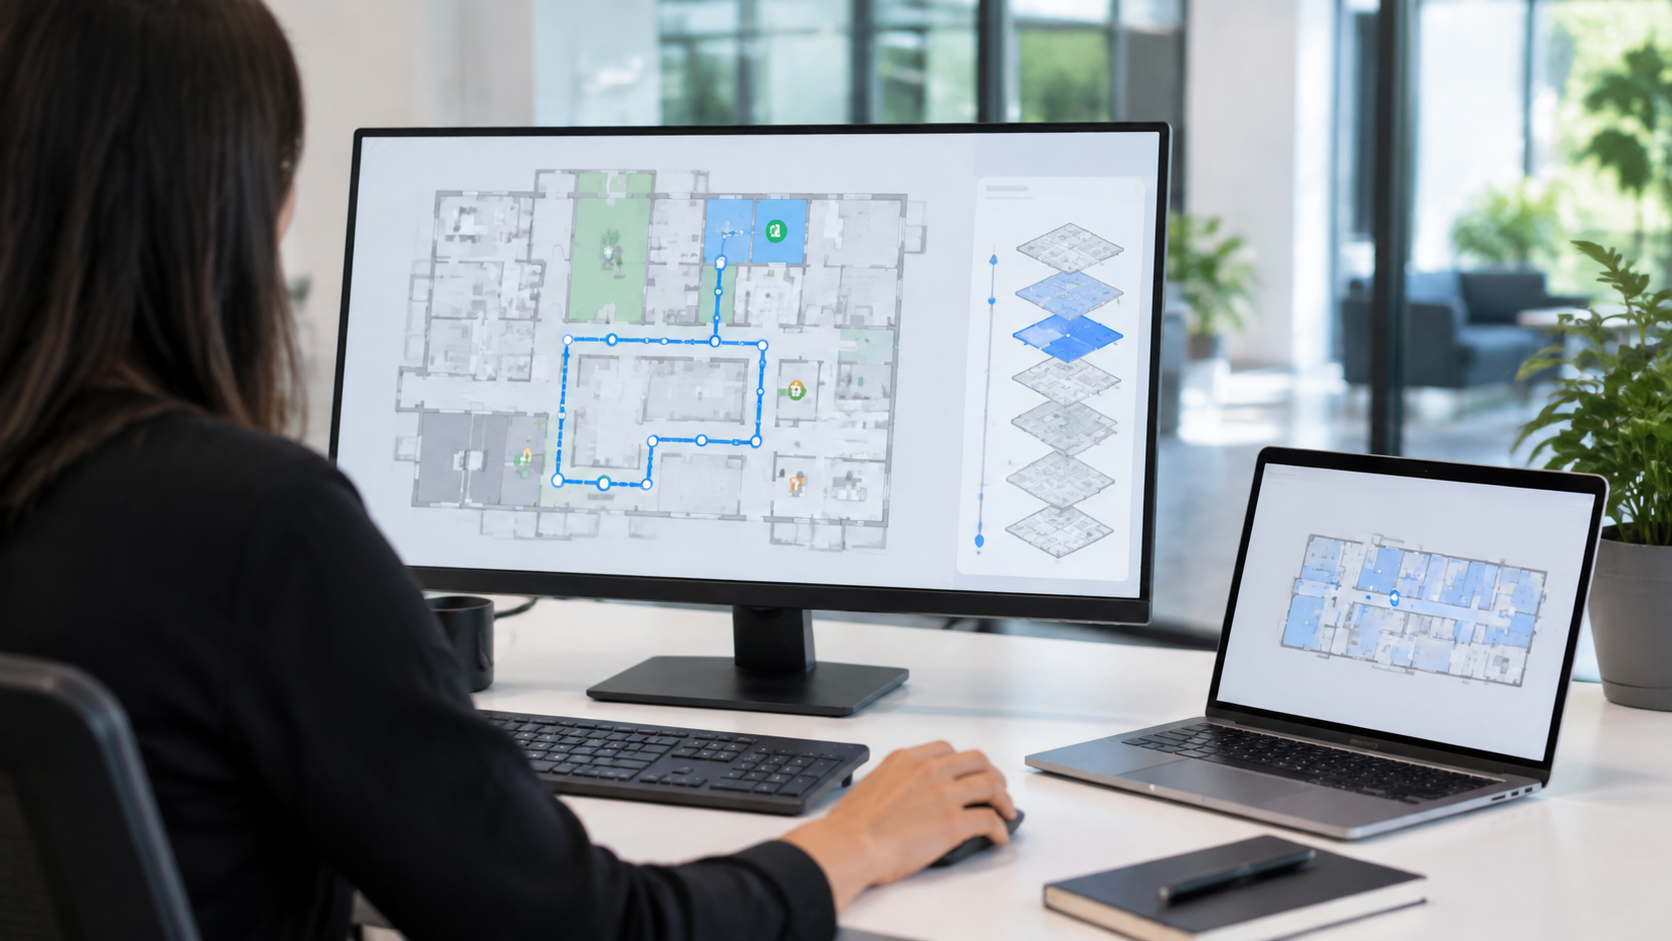
Most shopping centres already own the two halves of indoor mapping. They have a floorplan, usually a CAD file from the last refurbishment, and they have traffic data from thirty or forty counting points. What they do not have is the connection between the two. The Monday operations meeting still opens with a spreadsheet in which entrance 7 is up 4 percent and corridor C2 is down 11 percent, and nobody around the table can picture where C2 actually is without someone pulling up a PDF.
That gap is the whole point of indoor mapping as an analytics discipline. It is not about producing a prettier drawing. It is about making the floorplan the primary interface for traffic, occupancy and movement data, so that a facility manager, a leasing director and a marketing lead are all looking at the same square metres when they argue about them.
Where tables stop working
A single-entrance store can live happily in a table. Count in, count out, compare to sales, done. The problem begins around the tenth sensor, and it becomes acute in any multi-level property. A centre with four floors, nine entrances, two car park lifts and a food court has well over fifty measurement points, and the questions people ask are spatial by nature: Is the second-floor west wing dead after the anchor left? Does traffic from the metro entrance ever reach the top floor? Which escalator is carrying the load on Saturday afternoon?
None of those questions is answered by sorting a column. Each is answered in seconds by colouring a floorplan. This is why mapping tools such as VemMaps exist inside counting platforms: traffic and occupancy are rendered by floor and by zone, with multi-layer views so you can toggle between footfall, live occupancy and dwell on the same drawing, then export the view or set an alert on a zone threshold. The data has not changed. The reading time has.
What a floorplan has to carry before it counts as indoor mapping software
Executives evaluating platforms tend to see a demo with a heatmap and assume the job is done. In practice a floorplan becomes operational data only when it carries several distinct layers, each with its own refresh rate and its own owner.
- Counts per entrance and per zone, aggregated to the intervals your tenants are measured on, typically 15 minutes for operations and daily for leasing.
- Live occupancy per floor and per zone, which is the layer security and facilities actually watch, and the one that drives cleaning and HVAC schedules once they trust it.
- Dwell time and zone-to-zone flow, the movement layer. In Vemco's stack this comes from VemTrack, which uses anonymous AI re-identification to follow a visitor across sensor fields without identifying anyone, and draws the resulting paths, funnels and heatmaps straight onto the plan.
- Queue detection with alerts, usually at food court tills, customer service and parking payment machines, where a map showing a red zone is acted on faster than a notification saying queue length exceeded.
A product that only draws the first layer is a visualisation. Indoor mapping software worth budget is one where all four layers share one set of zone boundaries, so that the occupancy figure, the dwell figure and the flow figure for the west wing all describe the same polygon. Ask to see that in the demo. Ask the vendor to click one zone and show every metric for it.
Zones are a design decision, not a drawing exercise
Here is the part nobody puts in the brochure. The single most common reason indoor mapping projects disappoint is that zones get drawn by the leasing team along lease lines, and the sensors were installed by the counting team along sightlines. The two rarely coincide. A corridor zone drawn to end at a tenant's shopfront may sit half inside one sensor's field and half inside another's, and the resulting occupancy number for that zone is an estimate stitched from two partial views.
An experienced implementer will insist on walking the floor with the floorplan and the sensor coverage overlay before any zone is committed, and will often propose zone boundaries that look slightly odd on paper but align with where the stereo sensors actually see. Xovis-class 3D sensors, which Vemco deploys as a Xovis GOLD partner, produce clean coverage polygons that make this exercise straightforward, but only if someone does it. The accuracy you are contractually promised, a minimum of 96 percent and typically 98 to 99 percent where lighting and layout allow, applies to the count at the sensor. It does not automatically transfer to a zone somebody drew without checking coverage.
One more thing a floor walk reveals: the CAD file is almost always out of date. Kiosks have moved, a pop-up wall has gone up, a tenant has extended a display into the mall. Budget two days for reconciling the drawing with reality. It is cheaper than explaining to a tenant why the heatmap shows strong traffic in a spot that has been a hoarding since March.
Reusing the indoor maps you already paid for
Many centres already commissioned detailed indoor maps for a different reason: wayfinding kiosks, the centre app, indoor navigation for shoppers trying to find a store or a parking bay. Those maps were built to shopper-grade detail, with every unit, every lift and every toilet in place. It would be wasteful to rebuild them for analytics, and it is usually unnecessary.
Vemco integrates with Mappedin, so a map that already exists in that environment can carry Vemco traffic, dwell and occupancy layers instead of starting from a fresh drawing. The practical consequence is that the same floorplan geometry serves the shopper-facing indoor navigation on the kiosk and the operator-facing analytics in the back office. When a unit is re-let and the map is updated once, both views update. For property groups running several assets, that single source of geometry is worth more over a five-year lease cycle than any individual dashboard feature.
What the map changes in practice
Three uses tend to justify the project on their own. First, leasing conversations: showing a prospective tenant the dwell heatmap for the unit next to theirs, by hour and by day, is a stronger argument than a footfall total for the whole floor, and it is defensible because the zone and the sensor coverage match. Second, dead-zone diagnosis: when flow lines show that visitors from the main entrance peel off at the atrium and almost never reach the north arm, the fix is a routing or anchor conversation, not another promotion. Third, operations: occupancy by zone, updated live and alerted on thresholds, is what finally lets cleaning and security staff be scheduled against demand rather than against habit.
If you are shortlisting platforms, three questions separate real indoor mapping from a heatmap overlay. Can every metric be read per zone from the same boundaries? Can the map ingest geometry you already own rather than forcing a rebuild? And can the vendor show you, on a live site, the coverage overlay they used to define those zones? A yes to all three is rarer than the marketing suggests.
Frequently asked questions
What is indoor mapping used for? In retail property it is used to display footfall, live occupancy, dwell time, movement flow and queue status on a floorplan, by floor and by zone, instead of in tables. Operators use it to diagnose dead zones, support leasing discussions with location-specific traffic evidence, and schedule cleaning, security and facilities staff against actual occupancy. The same map geometry often also powers shopper wayfinding, so one drawing serves both visitors and management.
If your centre already has a floorplan and a counting system but the two still live apart, Vemco can review your sensor coverage against your existing zones and show how VemMaps and VemTrack would put traffic, dwell and occupancy onto the map you already use. Get in touch at vemcogroup.com/contact-us to arrange a floorplan and coverage review for your property.