








A mall operator we worked with had two maps of the same building. One was the wayfinding map on the kiosks and the app, maintained by marketing. The other was a PDF floorplan in the leasing team's shared drive, last updated when a food court tenant moved. Footfall numbers lived in neither. They sat in a weekly Excel export that said Zone 14 was down 9% and left everyone guessing which corridor Zone 14 actually was. That gap, between where the data is and where the building is drawn, is the real problem indoor mapping software should solve. Most evaluations miss it because they start with the map and never ask what the map will carry.
Two products are sold under one name
When a vendor says indoor mapping, they usually mean one of two things, and the budget consequences are different. The first is the map itself: a digital representation of floors, units, gates or lecture halls, used for wayfinding and asset management. The second is analytics drawn on a map: counts, occupancy, dwell and flow placed on a floorplan so that someone who has walked the building can read it in seconds. Buying the first does not give you the second. Buying the second without the first means you end up tracing floorplans twice.
This is why integration between a map platform and an analytics platform matters more than either product's feature list. Vemco integrates with Mappedin as an integration partner, so a property that already maintains an indoor map there can overlay Vemco traffic, dwell and occupancy data on it rather than rebuilding geometry inside a second tool. If your organisation has already spent money keeping a map accurate, that is the question to put to every analytics vendor first: can you draw on the map I already have?
What changes when occupancy is read by floor and zone
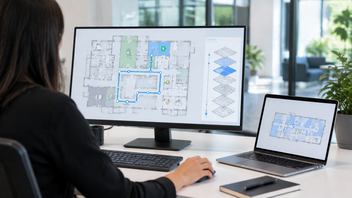
Tables are fine for finance. They are poor for operations. A centre manager deciding whether to open a second security lane, or an airport duty manager watching a pier fill up before a delayed departure, needs to see the pressure building spatially. VemMaps presents Vemco location data on maps with multi-layer views, so counting and occupancy can be switched between floors and zones, exported, and tied to alerts. The practical shift is that thresholds become geographic. An alert no longer says "Zone 14 at 92% of capacity"; it highlights the lower-ground atrium on the plan, which is the version a security supervisor can act on from a tablet.
Three recurring uses, by property type:
- Malls: comparing live traffic on the plan against the rent roll. A corridor with high footfall and a below-average sales density tenant is a leasing conversation, not a marketing one.
- Airports: occupancy layers by pier and gate cluster, so retail and F&B staffing follows the flight schedule rather than the clock.
- Campuses: space utilisation by building and floor, feeding decisions on which blocks to consolidate during low-occupancy terms.
Heat map software: the picture is only as good as the sensor plan
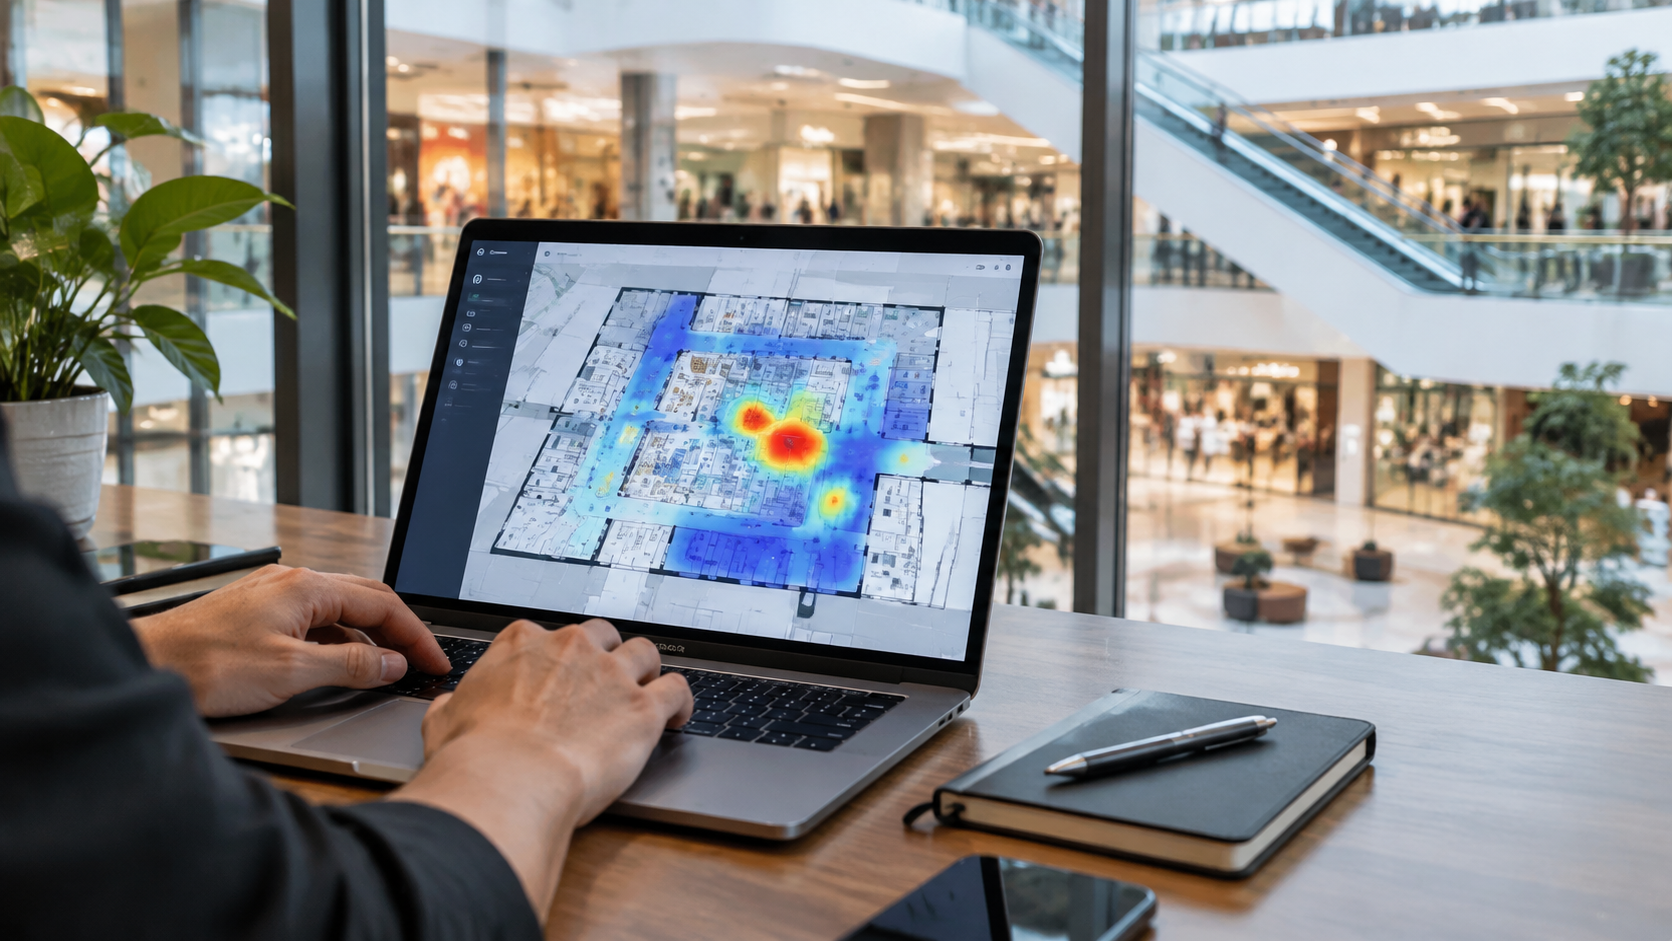
Every demo of heat map software looks persuasive. The warm patches are where you expected them, the cold corners confirm a suspicion, and the room nods. The practitioner observation that rarely gets aired is that a retail heat map is a rendering of sensor coverage first and visitor behaviour second. A ceiling-mounted stereo sensor covering a 10-metre-wide corridor at 4 metres height will produce a confident heat signature; a cold spot just beyond its field of view is not a dead area, it is an uncovered one. We have seen operators plan a tenant relocation on the strength of a cold zone that was simply the edge of a sensor's range.
So treat the map as a coverage document too. Ask the vendor to overlay sensor positions and fields of view on the same floorplan as the heat data. Ask how they handle the joins between adjacent sensors, because double counting at overlaps is where accuracy quietly erodes. Vemco's counting is contracted at a minimum of 96% accuracy and typically runs at 98 to 99% when lighting, layout and visitor behaviour allow, but those figures assume a sensor plan designed for the space, not one inherited from a previous CCTV layout.
From where people are to where they go
Counting tells you how many. Indoor mapping of movement tells you the sequence, which is where property decisions actually live. VemTrack sits on top of counting and adds anonymous movement analytics shown directly on floorplans: dwell time per zone, zone-to-zone flow, visitor journeys, path and funnel analysis, and queue detection with alerts. Anonymous AI re-identification links a visitor's movement across sensors without identifying anyone, which matters both for GDPR reviews and for tenant trust when you share corridor data.
The funnel view is the one executives tend to underrate. Picture an airport: 100% of passengers clear security, 61% pass the first retail node, 23% enter a store, 8% reach a till. Drawn on the pier plan, that funnel shows which turn loses the most people, and whether a signage change or a kiosk relocation is the cheaper fix. In a mall, the same analysis run on a floorplan answers the oldest leasing argument there is: whether the anchor really drives traffic past the inline units, or whether shoppers take the escalator straight down to the car park.
Questions to put in the RFP
- Map ownership: if we leave, do we keep the floorplan geometry and zone definitions in an open export?
- Layering: can counts, occupancy, dwell and flow be toggled as separate layers on one plan, by floor?
- Alerts: are capacity and queue alerts configurable per zone and routed to the people on that floor?
- Sensor neutrality: which hardware is supported? Vemco works with Xovis as a Xovis GOLD partner, alongside Milesight, Hikvision and AXIS, which matters if you have mixed estates or an existing camera investment.
- Downstream data: can map-based zone data flow into BI, POS or lease systems rather than staying inside the viewer?
The last point is where the mall operator from the opening ended up. Once zones were drawn on one shared map and the footfall per zone was pushed into the leasing dataset, Zone 14 stopped being a mystery and became a specific stretch of the lower mall with a named tenant mix and a renewal date. The map did not make the decision. It made the decision arguable with evidence.
Frequently asked questions
What is indoor mapping software used for? In commercial property it is used to place operational data, such as visitor counts, occupancy, dwell time and movement flows, onto digital floorplans so that teams can read building performance by floor and zone instead of in tables. Malls use it for leasing and marketing decisions, airports for staffing and passenger flow, and campuses for space utilisation. The most useful implementations connect an existing wayfinding map to an analytics platform rather than maintaining two separate maps.
If you are weighing indoor mapping software for a mall, airport or campus and want to see your own floorplan carrying live traffic, dwell and occupancy layers, contact Vemco Group for a mapped walkthrough using your building, not a demo site.