/global/header/smart-buildings.svg)


/global/header/facility-management.svg)






/global/header/leisure.svg)







Here is a number most hypermarket operations directors have never seen for their own stores: the ratio of dwell time to sales per square meter, zone by zone. Almost every chain can pull sales per square meter from their ERP. Almost none can tell you whether a low-performing bay is failing because nobody walks past it, because people walk past but never stop, or because they stop, look, and put the product back. Those are three completely different problems with three completely different fixes — and a category-level P&L cannot distinguish between them. Grocery store zone analytics exists to close exactly that gap.
Why conversion rate is the wrong metric for grocery — and what replaces it
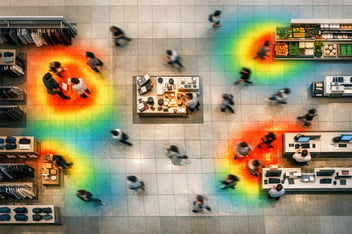
Fashion retailers obsess over door counts and conversion because a visitor who leaves without buying is the core problem. Grocery is different. Your transactions already measure purchasing activity — nearly everyone who enters buys something, so a store-level conversion rate tells you almost nothing you did not already know. That is why grocery stores typically do not need people counting for conversion at all. The real value sits inside the store: measuring traffic flows, viewing direction, dwell time and engagement across defined areas, so you can classify zones as A, B or C based on actual customer behavior rather than the floor plan someone drew five years ago.
The distinction matters commercially. An "A zone" on paper — say, the head of the main aisle near produce — may in practice receive heavy pass-by traffic but low engagement, because customers are in transit mode with a trolley and a mission. Meanwhile a mid-aisle bay near the bakery may show shorter footfall numbers but dramatically longer dwell and viewing time. If you are pricing promotional space or vendor placements off the floor plan instead of the behavior, you are almost certainly mispricing both.
Sales per square meter, decomposed
Space planners already work with sales per square meter, but as a single output figure it hides the mechanics. Zone analytics lets you decompose it into a chain of measurable steps for any bay, gondola end or promotional island:
- Exposure: how many customers actually pass the zone per hour, per daypart, per weekday.
- Attention: of those passing, how many turn toward the fixture — viewing direction is measurable, not assumed.
- Engagement: dwell time at the fixture, which separates browsing from transit.
- Conversion to basket: sales data mapped to the zone, closing the loop.
Once you see the chain, the intervention becomes obvious. Low exposure is a layout and adjacency problem — move the category or redirect flow. Strong exposure but weak attention is a merchandising and signage problem. Strong dwell but weak sales points at assortment, pricing or availability. Category managers stop arguing about whose fault the number is and start fixing the specific broken link. In our experience this single reframing changes more planogram meetings than any dashboard ever does.
Staff routing: stop paying people to re-walk checked aisles
In a 5,000–10,000 m² hypermarket, a meaningful share of every shift is spent simply walking — looking for gaps, checking dates, finding out where attention is needed. People counting combined with staff tracking turns this into an operational tool rather than a reporting exercise. Instead of employees patrolling the store to discover which shelves or departments need work, the system gives data-driven direction: teams see which zones were already visited during a shift and which still need attention. An employee starting an afternoon shift sees exactly which zones were covered in the morning and goes straight to areas still waiting for shelf replenishment, expiry-date checks or merchandising resets.
Heatmaps and traffic-flow analytics add the prioritization layer: the shelves and zones with the highest customer activity right now are the ones where an empty facing or a messy display costs the most, so teams go there first instead of re-walking an aisle someone checked an hour earlier. Across a large-format store this saves significant employee time and cuts unnecessary walking distance — the objective is simple: use precise data to tell employees where their attention is needed, and nowhere else.
One observation from implementations that rarely makes it into vendor brochures: the biggest resistance is not from the floor teams, it is from department heads who have run their sections on routine walk patterns for fifteen years. The projects that stick are the ones where those department heads help define the zone map and task priorities in the first two weeks — once the zone boundaries match how they actually think about their section, adoption follows quickly. Draw the zones purely from the ceiling plan without them, and you will fight the rollout for months.
Turning zone data into vendor revenue
For retail property teams and anyone negotiating trade spend, zone analytics changes the conversation with brands. Today, most placement fees are negotiated on location and assumption: "end cap near entrance, therefore premium." With behavioral data, the operator demonstrates actual traffic, customer flow, dwell time and sales performance per zone. The vendor sees not only what they sold, but how customers moved around their location and how much exposure the space actually generated. That is a materially stronger foundation for rental pricing, renewal negotiations and upselling brands into genuinely premium positions — and it protects you when a brand claims a position "did not work" when in reality their product did not convert the attention it received.
A practical starting point: pick your ten most contested promotional positions, run zone measurement for two full promotional cycles, and re-rank them by exposure and dwell rather than by tradition. Most operators find at least two positions priced well above their behavioral value and two underpriced ones — and that alone usually funds the analytics program.
What to demand on accuracy and integration
Two buying criteria matter more than feature lists. First, honest accuracy figures: Vemco commits to a contractual minimum of 96% counting accuracy, typically reaching 98–99% when conditions such as lighting, store layout and visitor behavior allow. Be skeptical of any provider quoting a flat guaranteed figure with no conditions attached — hypermarket environments with trolleys, children and dense promotional periods are exactly where lab numbers fall apart. Second, insist that footfall, flow, zone analytics, heatmaps, staff activity and sales data land in one operational picture rather than three disconnected dashboards. The value is in the combination: a heatmap without sales data is decoration; sales data without flow context is the P&L you already have.
The end state is not a report. It is a store where layout decisions are tested against measured behavior, where every square meter carries a demonstrable commercial value, where vendors pay for exposure you can prove, and where your teams spend their hours restocking and merchandising instead of searching for what needs doing.
Ready to see what your zones are actually worth? If you run hypermarkets or grocery stores and want to decompose sales per square meter, re-price promotional space on real behavioral data, or cut wasted walking time from your shifts, talk to the Vemco team about a zone analytics pilot in one of your stores: contact Vemco Group here.