/global/header/smart-buildings.svg)


/global/header/facility-management.svg)






/global/header/leisure.svg)






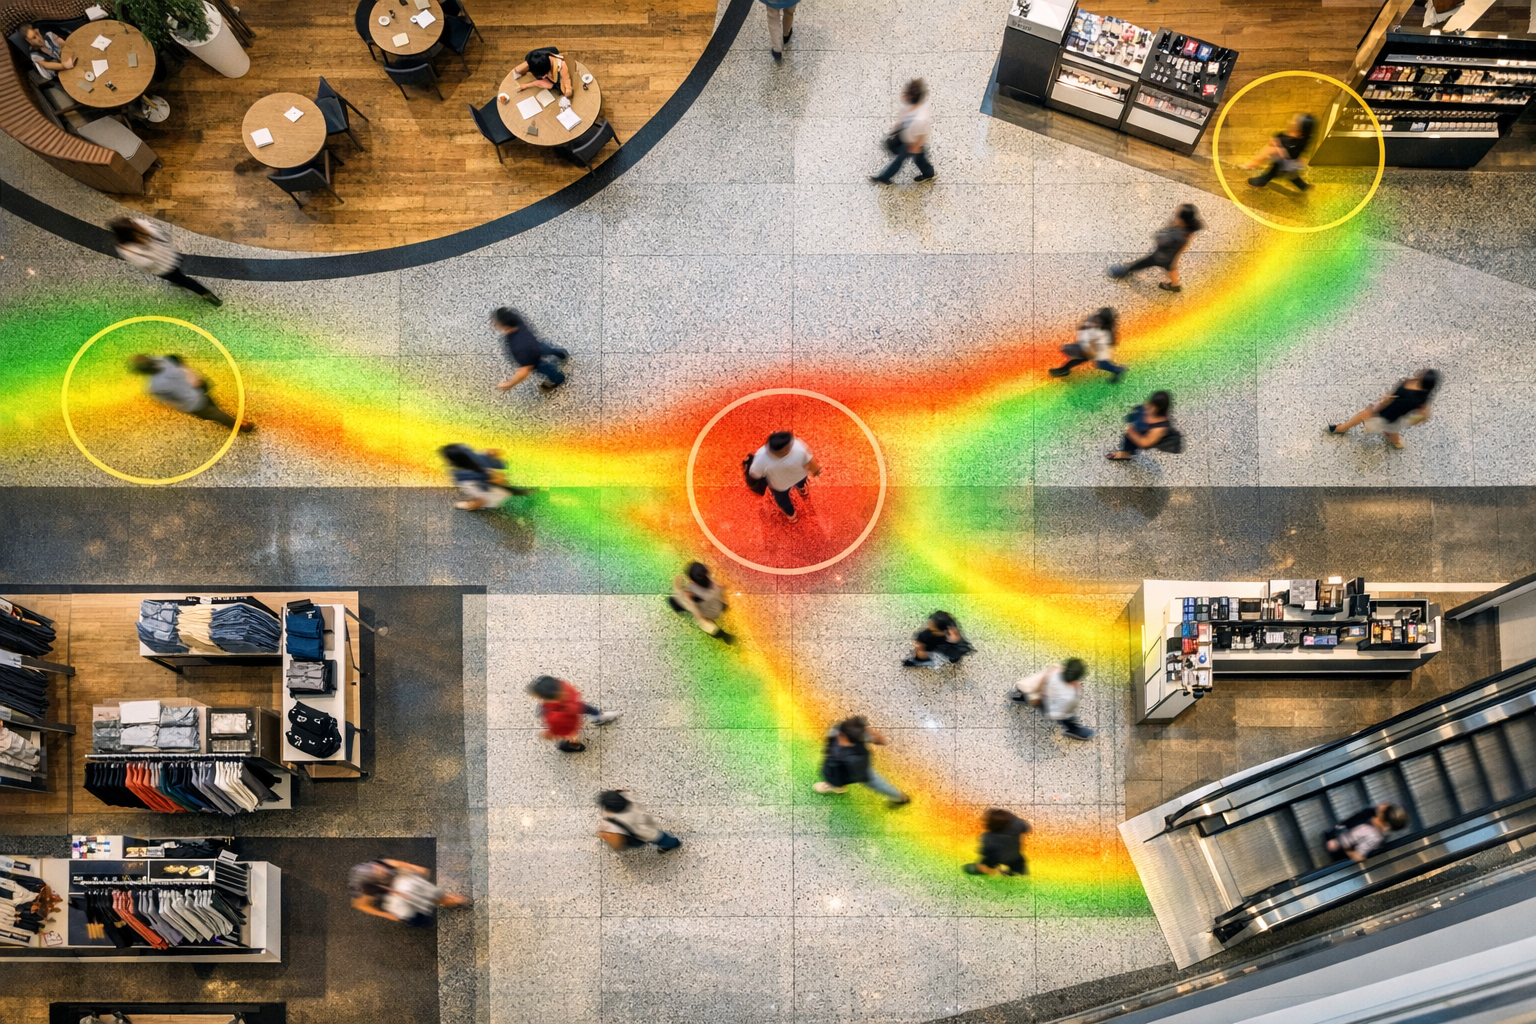
A tenant paying premium rent next to your anchor store can still be invisible. Not because the anchor fails to pull traffic — it does — but because the flow it generates turns left at the atrium and never passes that tenant's façade. This is the uncomfortable truth cross-store behavior data keeps exposing: adjacency on a floor plan and adjacency in the shopper's actual journey are two different things, and leases are still priced on the first while revenue depends on the second.
Most mall operators already track entrance counts. Fewer track what happens between entrance and exit — the sequence of stores visited, the zones skipped, the dwell before a purchase decision. That sequence is where the money conversations live: tenant mix, lease renewals, marketing fund allocation, and the perennial argument about who actually benefits from the food court.
What cross-store behavior actually measures
At its core, cross-store analysis answers four questions that single-point people counting cannot:
- Journey sequencing: which stores are visited together, in what order, and which pairings almost never occur despite physical proximity.
- Zone conversion: what share of traffic passing a corridor actually enters a store there, versus treating it as a transit route.
- Dwell distribution: where time is spent versus where distance is covered — a shopper can walk 60% of the mall and spend 80% of their time in two zones.
- Demographic flow: how journeys differ by visitor profile. Modern AI sensors can estimate age and gender and separate children from adults, which matters enormously when a toy store claims the adjacent café drives its traffic — or vice versa.
The technical foundation is a network of counting and tracking sensors — 3D AI units like Xovis, or hardware from Milesight, Hikvision, and AXIS — feeding a platform that stitches individual zone counts into journey patterns. Vemco Group, which has built retail analytics software since 2005 and now counts more than 60 million people every day across 55,000+ installations in 98+ countries, designed its VemTrack and VemSpace modules specifically for this stitching problem: turning isolated doorway counts into a mall-wide movement picture. Because the platform is sensor-agnostic, operators who already have Hikvision or AXIS hardware installed rarely need to rip anything out.
The leasing conversation changes when you have journey data
Leasing directors know the ritual: a tenant requests a rent reduction citing "low mall traffic," the operator counters with entrance figures showing traffic is fine, and the negotiation stalls because both sides are technically right. Cross-store data resolves this. If the mall's total traffic is up 6% but the corridor serving that tenant is down 12% because a reconfigured escalator rerouted flow, the tenant has a point — and the operator has an actionable fix that doesn't involve permanent rent concessions.
It also changes how you price space in the first place. Zone-level capture rates let you build a rent model on demonstrated exposure rather than square meters and floor level alone. Some operators using tenant-facing platforms like VemTenant and VemLease go further: they share zone traffic with tenants as part of the lease relationship, which shifts renewal talks from adversarial to analytical. A tenant who can see their capture rate declining while corridor traffic holds steady knows the problem is their window display, not your mall.
Tenant mix: stop guessing at complementarity
The traditional tenant-mix logic — put fashion near fashion, cluster F&B, anchor the corners — is directionally sound but blunt. Journey data reveals the actual complementarity pairs in your mall, with your catchment. A sporting goods store and a pharmacy may share more journeys than two fashion retailers on the same corridor, because both serve the weekday errand-runner rather than the weekend browser. That insight should influence where you place the next vacancy, which co-marketing campaigns you fund, and which tenant categories you actively recruit.
Demographic separation sharpens this further. If your data shows families with children dominate weekend mornings but the zones near your children's retailers convert poorly during exactly those windows, that's not a traffic problem — it's a placement or wayfinding problem, and it's fixable within a quarter.
What implementers learn the hard way
Here is the observation almost every deployment team makes and almost no vendor brochure mentions: your first three months of cross-store data will be dominated by staff movement unless you filter it out. Mall employees, cleaners, security patrols and delivery personnel cross zone boundaries dozens of times per shift, and in quieter corridors they can account for a startling share of raw counts. Staff-exclusion algorithms — Vemco's remove employees from counts automatically — are not a nice-to-have; without them, your quiet-zone conversion figures are fiction. The same discipline applies to accuracy expectations generally: reputable providers commit to a contractual minimum of 96% counting accuracy, typically reaching 98–99% when lighting, layout and visitor behavior allow. Anyone quoting a flat guaranteed figure regardless of site conditions hasn't installed enough sensors in atriums with skylights.
A second hard-won lesson: define your zones around decisions, not architecture. Operators often map zones to the building's wings because it's tidy. But if the decision you need to make is "does the cinema drive evening F&B traffic," your zones must isolate the cinema exit path and the restaurant cluster — even if that cuts across three architectural wings. Zone design is an analytics decision disguised as a floor-plan exercise.
Making the data operational, not decorative
Cross-store dashboards fail when they live only in the marketing department. The data earns its budget when it flows into the systems where decisions are already made — leasing models, ERP, BI reporting. Platforms like VemCount and VemFusion integrate with ERP and BI stacks precisely so that a leasing director sees zone performance next to rent-per-square-meter, not in a separate portal they open twice a year. Whether you run it hosted or in a private cloud is a governance choice; what matters is that journey metrics sit beside financial ones.
Start with one question — a contested lease renewal, an underperforming corridor, a proposed anchor relocation — and instrument for that. Malls that begin with a specific commercial dispute get to defensible answers within a season. Malls that begin with "let's measure everything" get dashboards.
Ready to see how shoppers actually move through your mall? Vemco Group has spent 20 years building people-counting and journey analytics for operators in 98+ countries, and our team can map a zone strategy around your specific leasing and tenant-mix questions — using the sensors you may already own. Contact us to discuss a cross-store behavior pilot for your property.