/global/header/facility-management.svg)


A shopper who stands in front of your outerwear wall for 40 seconds and walks away tells you more than a clean sales report ever will. The sale that didn't happen is invisible in your POS. It is fully visible in your aisle. That gap — between attention and purchase — is where in store behavior analytics earns its budget, and it is where most retailers are still guessing.
Interest is a behavior, not a feeling
You cannot survey your way to genuine interest. Exit interviews are biased and small. What you can measure is what people physically do: where they slow down, what they approach, how long they linger, and whether that lingering ends in a basket or a shrug. Three signals carry most of the weight here.
- Dwell time — how long a person stays in a defined zone. Rising dwell with flat sales is a pricing, sizing or stock problem, not an awareness problem.
- Capture rate — the share of passing traffic a display or department pulls in. This judges your merchandising, not your footfall.
- Flow and sequence — the order in which zones are visited. It exposes the dead corners your floor plan quietly creates.
Footfall is the denominator, not the answer
Counting people through the door is the starting point, and accuracy at that point matters more than vendors admit. Vemco Group, counting since 2005 from its Fredericia R&D centre and processing more than 25 million counts a day, frames this honestly: a contractual minimum of 96%, typically 98–99% when lighting, store layout and visitor behaviour allow. That range is not marketing softness — it reflects reality. A poorly lit entrance with a glass reflection will sit lower than a clean, well-lit doorway. Knowing your true denominator is what makes conversion math trustworthy.
One detail that catches teams off guard: if you do not exclude staff, your conversion rate is silently wrong all day. Employees walking the floor, restocking, and crossing thresholds inflate traffic and depress conversion. Staff-exclusion algorithms remove that noise so a busy associate doesn't read as a browsing customer who failed to buy.
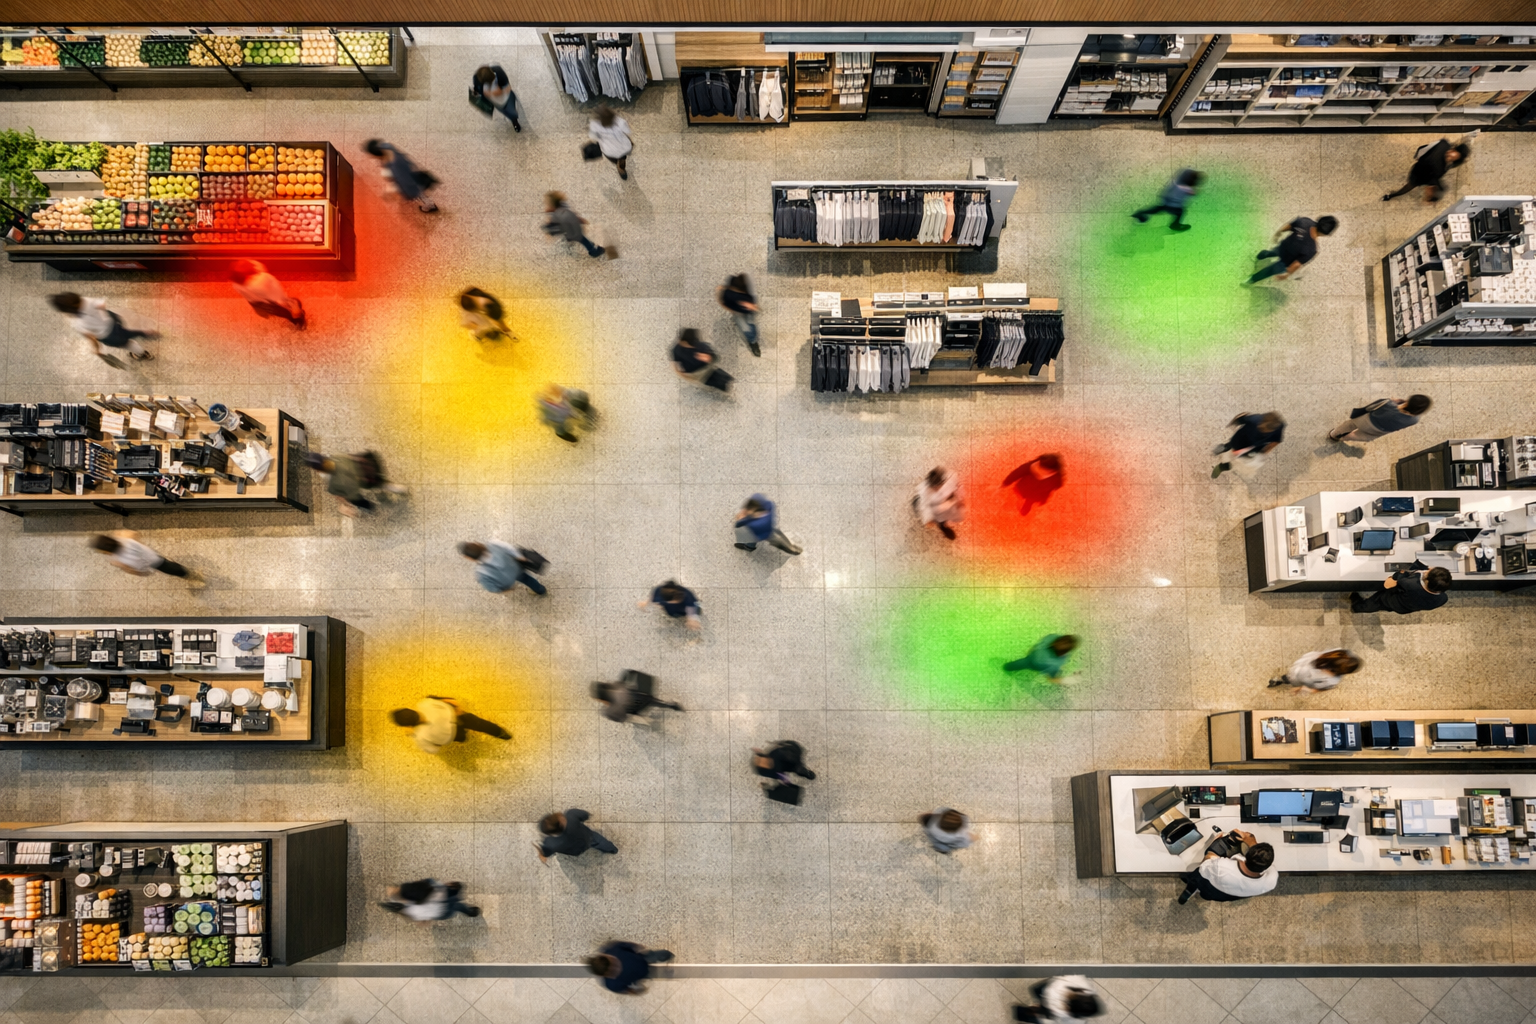
From counts to interest signals
Once the denominator is solid, layer behaviour on top. Zone-level data turns a flat floor into a map of attention. A promotional end-cap that draws high dwell but low conversion is sending a clear message — the offer interested people, the execution lost them. Maybe the price wasn't visible. Maybe the adjacent size run was empty. The data names the suspect; your staff confirm it on the floor.
AI sensors add another dimension. They can detect approximate age and gender and separate children from adults, which sharpens how you read interest by audience. A homeware display that holds adult attention but is constantly crossed by families heading to a play area is telling you two different things about the same square metres. With sensor partners such as Xovis 3D AI, Milesight, Hikvision and AXIS, and a device-independent approach, the analytics layer doesn't force you to rip out hardware you already trust.
Inside the store and beyond the door
Interest doesn't begin at the threshold. Weather-resistant outdoor sensors measuring up to 20 metres — the type deployed with Odense Municipality — let you see how many people pass versus how many you actually pull in. That outside capture rate is one of the most under-used numbers in retail. A window that 8% of passers-by react to is a different conversation with your visual merchandising team than a window that 2% notice.
Vemco's modules each take a slice of this picture:
- VemCount — core people counting and conversion measurement.
- VemTrack — staff and labour planning against real traffic.
- VemTenant — shared traffic intelligence for landlords and tenants.
- VemSpace — zone, dwell and flow analysis for layout decisions.
- VemFusion — combined data streams for a single store view.
- VemLease — traffic-based insight to support rental and tenancy terms.
Making the data move decisions
Data sitting in a dashboard changes nothing. The retailers who get value tie behaviour metrics to a person and a routine. A store manager who checks Saturday's capture rate on the new fragrance gondola every Monday, and then physically moves it two metres if the number disappoints, is running a weekly experiment. That cadence is worth more than a quarterly report nobody acts on.
Connecting the analytics to your existing ERP and BI tools — hosted or in a private cloud — keeps the conversation in the systems your teams already open. When dwell and capture data sit next to sales and inventory, the cause-and-effect debate gets shorter. You stop arguing about whether the promotion worked and start agreeing on which part of it failed.
A practical place to start
Don't instrument the whole store at once. Pick the three zones tied to your highest-margin or most contested categories. Establish a clean baseline for dwell, capture and conversion. Run one change at a time — a price tag, a fixture move, a re-facing — and read the behaviour shift before and after. With 1,000+ customers across 95+ countries, the pattern Vemco sees repeatedly is that the first honest baseline is the moment teams realise how much interest they were leaving on the floor unmeasured.
Customer interest is already happening in your aisles every hour you trade. The only question is whether you can see it. If you want to map dwell, capture and conversion in your own stores and turn browsing into a number you can act on, talk to the Vemco Group team about a behaviour analytics setup built around your floor plan.