/global/header/smart-buildings.svg)


/global/header/facility-management.svg)






/global/header/leisure.svg)






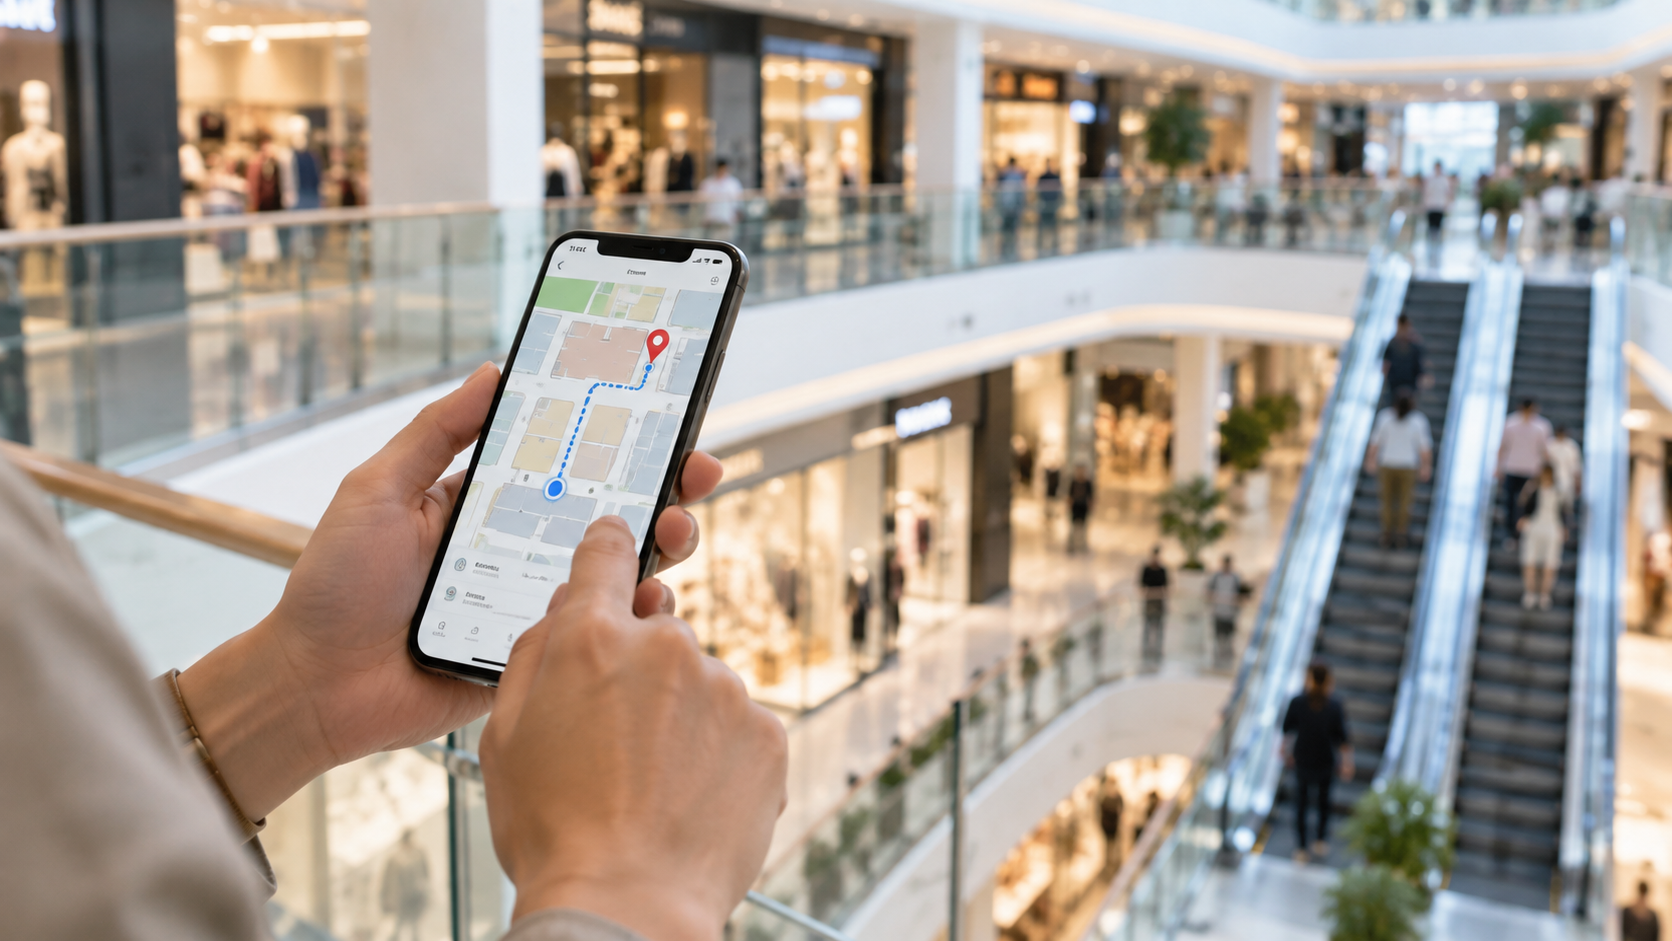
Picture a centre manager who has spent a year's marketing budget on new directory screens and a mall map app. Footfall at the main entrance is up 4%. Yet the two anchor-adjacent units at the far end of level 1 are still reporting flat sales, and both tenants are asking about rent relief. The directories are working exactly as designed. The problem is that visitors are reading the map, turning the wrong way, and never finding out what is at the end of that corridor.
That is the uncomfortable truth about mall wayfinding. It is usually treated as a signage and software question. In practice it is a layout question wearing a signage costume. The routes visitors actually walk, measured rather than assumed, tell you where the building itself is fighting against the plan on the leasing brochure.
Three route patterns that point to a layout fault, not a signage fault
Once you have zone-to-zone flow and path analysis on a floorplan, a handful of signatures show up again and again. Each one looks like a wayfinding problem and is really a layout decision from years ago.
- The U-turn at the directory. A spike in dwell within three to five metres of a kiosk, followed by a reversal. Visitors look, orient themselves, and walk back the way they came. The map is oriented north-up while they are facing south, or the "you are here" marker sits on a junction that reads ambiguously. The sign is fine; the junction is not.
- The escalator shadow. People stepping off an escalator keep walking in the direction they are already facing. The units immediately behind the landing, often a prime-rent position on paper, receive a fraction of the level's traffic. Heatmaps show it as a cold pocket next to the hottest spot on the floor.
- The corridor with no second reason. A wing where entry counts are healthy but the journey data shows almost nobody passing the midpoint. There is nothing visible from the entrance that promises a destination, so visitors treat it as a dead end even when it is not. Signage can nudge this; a relocated café or a visible anchor entrance fixes it.
None of these show up in a total footfall figure. They only appear when counting is extended into movement: where people go next, how long they stop, and which zones they skip entirely. That is the layer VemTrack adds on top of entrance counting, with zone-to-zone flow, dwell time, path and funnel analysis shown directly on the floorplan rather than in a spreadsheet.
What the wayfinding app knows that sensors do not, and the reverse
If your centre runs a wayfinding app, you already have a dataset many operators ignore: search queries and requested routes. That is intent. It tells you which tenants people are trying to reach and from where. Movement analytics tells you what happened afterwards. The gap between the two is where money leaks.
A practical example. Routing requests from the car park entrance to a level 2 restaurant are frequent, but the zone data shows a large share of those visitors stopping on level 1 near the escalator for two to three minutes and then dispersing. The app route is correct. The escalator is hidden behind a promotional stand that was placed there because the spot "gets a lot of traffic." It gets traffic precisely because people are standing there confused. Remove the stand and the restaurant's lunch covers go up without a single marketing euro spent.
The point is that indoor wayfinding software and movement sensors answer different questions. Only together do they say whether the building is honouring the promise the map makes.
Reading it by floor and zone, not by table
Operations teams rarely lack data. They lack a way to look at it that matches how they think about the building. A list of 40 zones with hourly counts does not tell anyone that the north wing of level 2 goes quiet at 15:00 while the food court is at capacity. A multi-layer map view does, instantly.
This is what VemMaps is for: traffic, occupancy and dwell presented on the actual floorplan, layered by floor and zone, with export for leasing reviews and alerts when a zone crosses a threshold you set. If the centre already has an indoor map built in Mappedin, Vemco integrates with it, so the existing map carries the live traffic and dwell data instead of being rebuilt in a second system. For a commercial team that already uses that map for tenant plans, this matters more than any new dashboard.
A practitioner note on directory placement
Anyone who has installed sensors in a dozen centres learns this quickly: the first eight to ten metres inside an entrance is a transition zone where visitors adjust to light, temperature and noise and barely register anything. Directories placed inside that stretch are walked past, then hunted for later. Directories placed just beyond it, at the first genuine decision point, get read. The dwell data makes this visible within a week. Moving a directory a few metres can change its measured engagement, and the U-turn signature in the corridor behind it is the thing to compare before and after.
One caution on the numbers you will be reading. Counting accuracy with a contractual minimum of 96%, typically 98 to 99% where lighting, layout and visitor behaviour allow, is more than enough for route and dwell analysis. But escalator landings, glass atriums and heavy pram traffic are exactly the places that push conditions toward the lower end. Validate sensor placement in those spots before you base a rent conversation on them.
A six-week test any centre can run
Pick one wing where tenants complain and the floorplan looks fine. Then:
- Baseline two weeks of zone-to-zone flow, dwell and pass-through rate at the wing's midpoint. Pull routing requests for that wing's tenants from the wayfinding app for the same period.
- Make one change only. Move a directory, open a sightline by relocating a kiosk, or add a visible destination cue at the wing entrance.
- Measure the same four weeks. Pass-through past the midpoint and dwell at the far units are your success metrics, not total entrance footfall, which will barely move.
If pass-through rises and tenant sales follow, you have a layout fix. If routing requests are high but pass-through stays flat, you have a stronger case for a physical intervention, and the data to put in front of the asset manager.
Where this lands commercially
Route data changes three conversations. Leasing stops pricing units by distance from the entrance and starts pricing by measured exposure. Marketing stops promoting "the centre" and starts promoting the wing that journey data shows is under-visited relative to its tenant quality. And tenant relations stop being arguments about whose fault the quiet corridor is, because both sides are looking at the same floorplan with the same flows on it.
Mall wayfinding, properly measured, is less a visitor service than a diagnostic for the building. The map app tells visitors where to go. The routes tell you why they did not.
Frequently asked questions
How does mall wayfinding help tenants? Good wayfinding, backed by movement data, shows a tenant how many visitors reach their corridor, how many pass the door and how long they linger, instead of a centre-wide footfall number that says nothing about their unit. It also gives centre management hard evidence to fix the sightline, directory or kiosk that is diverting visitors before they arrive. For tenants, that converts a vague complaint about "no traffic" into a specific, measurable change request.
Can a mall map app replace physical directories? Not in practice. App data captures the intent of visitors who downloaded it, while the majority still orient themselves with physical signs and sightlines. Use the app's routing requests as a demand signal and sensor-based route data as the measure of whether the building delivers on it.
If one wing of your centre underperforms its floorplan and you want to see the actual visitor routes, dwell and zone flow on your own map before deciding whether the fix is signage or layout, talk to the Vemco Group team about a wayfinding and flow assessment for your centre.