/global/header/smart-buildings.svg)


/global/header/facility-management.svg)






/global/header/leisure.svg)






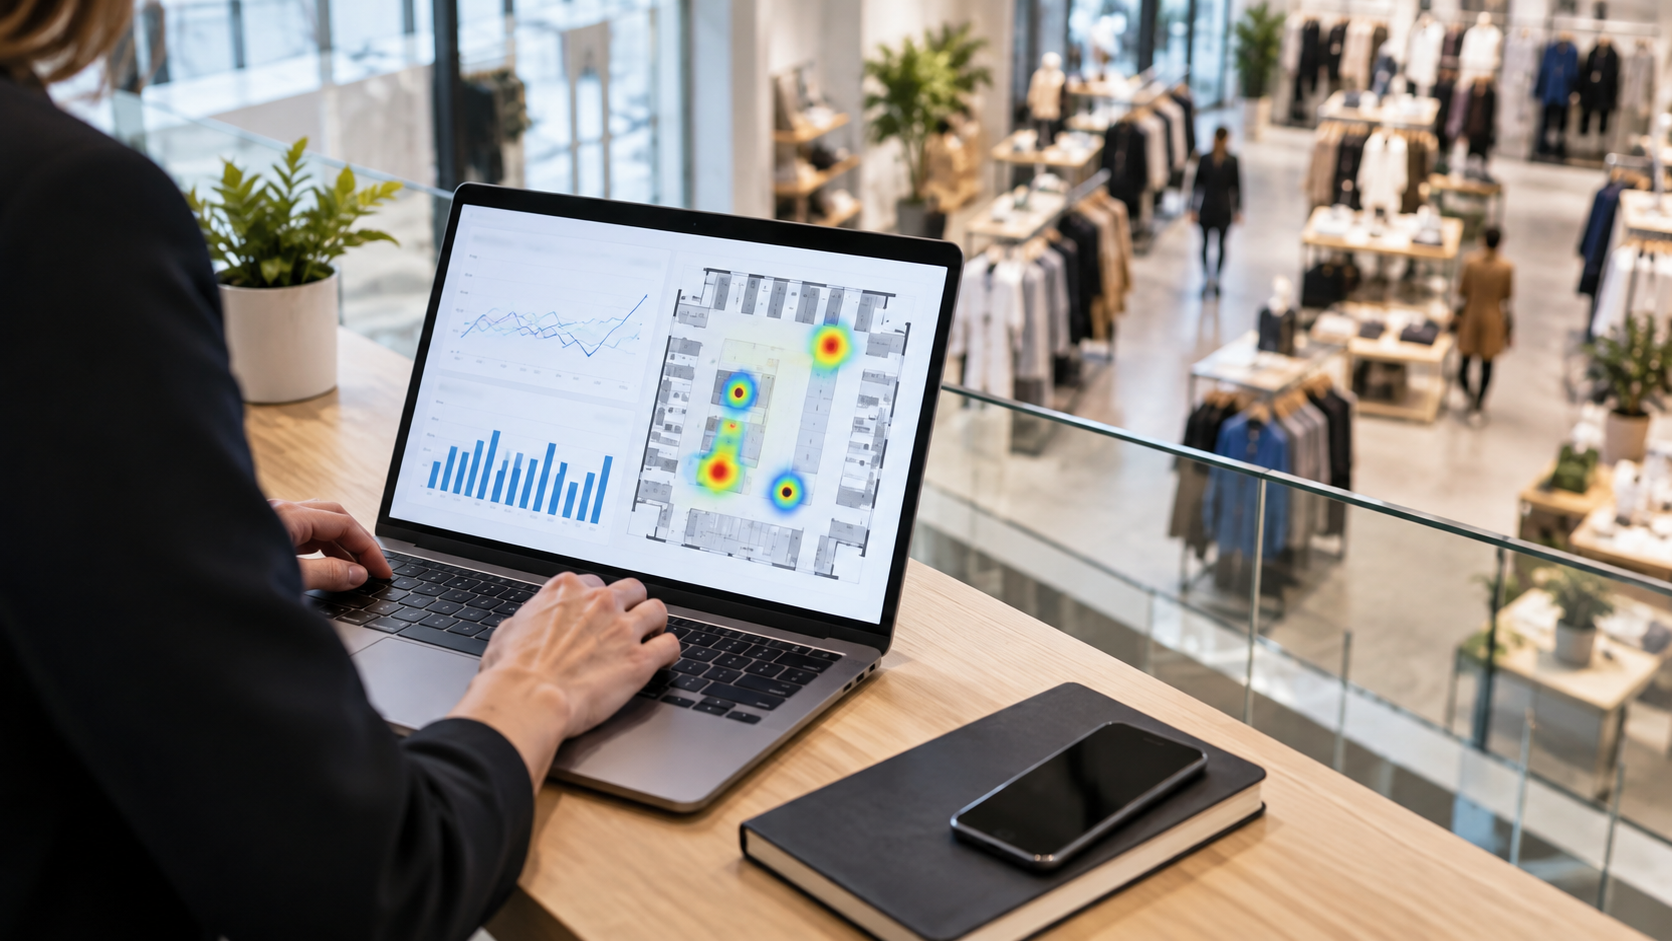
Monday morning, the weekly sales report shows a store down 6% year on year. The store manager says the weather kept people away. The regional manager suspects the new roster. The marketing team points to a competitor's campaign. Everyone has a theory, and nobody can settle it, because the only number in the room is revenue. Revenue is the end of the story. Retail traffic analytics is how you get the beginning and the middle.
Most articles on this subject explain why footfall matters. This one is about how to measure it so that the number survives scrutiny in a budget meeting.
Decide which four numbers you are actually collecting
Traffic analytics is not one metric. In practice a retailer needs four, and each has its own measurement method:
- Footfall: unique entries per time interval, with staff, children and re-entries handled by explicit rules, not guesswork.
- Conversion or hit rate: transactions divided by visitors for the same interval. The interval matters; a daily conversion figure hides a 9% morning and a 22% evening.
- Capture rate: visitors entering as a share of people passing the storefront. Only measurable if you also count the outside flow, which most retailers skip and then wonder why campaign impact is invisible.
- Dwell and path: how long visitors stay and which zones they reach. This requires in-store tracking rather than door counting.
Write down which of the four you need before anyone talks about hardware. A discounter with one entrance and a five-minute average visit needs footfall and hourly conversion. A furniture retailer with a 45-minute visit needs dwell and zone analytics far more than a precise capture rate.
Sensor placement determines the number more than sensor brand
Two identical 3D sensors installed in two stores of the same chain can produce counts that differ in reliability by several percentage points purely because of mounting position. The common errors are predictable. A sensor placed too close to a double door counts people who stop in the vestibule and turn back. A sensor over a wide mall entrance with no clear counting line records shoppers who cut across the threshold without entering. Shelving or a promotional table placed under the sensor after installation creates a blind spot nobody notices for months.
Here is the observation most implementers learn the hard way: in stores with fewer than 300 daily visitors, staff movement through the main entrance can account for 5 to 10 percent of raw counts. Deliveries, smoke breaks, colleagues fetching stock from a car. In a large store this is statistical noise. In a small one it moves the conversion rate by a full point or more. Either route staff through a side door, use a staff-exclusion zone, or accept and document the bias so it is at least consistent across periods.
Validate before you trust, and be honest about accuracy
Every new installation should be validated with a manual count. Not a ten-minute glance, but at least two hours across three distinct periods: a quiet morning, a lunch peak, and a Saturday afternoon. Compare the manual tally with the sensor output interval by interval. If the deviation is consistent, calibration fixes it. If the deviation swings between periods, something in the environment is interfering, typically low-angle sunlight, reflective flooring, or groups walking side by side through a narrow line.
On accuracy, ask vendors for a contractual figure, not a brochure figure. Vemco commits to a minimum of 96% and typically achieves 98 to 99% where lighting, layout and visitor behaviour allow. That phrasing is deliberate. A store with a dark entrance, a revolving door and constant pushchair traffic will sit closer to the floor of that range, and a supplier who promises a flat 99% everywhere has not seen your store.
Match traffic to transactions at the hour, not the day
The point where traffic analytics becomes commercially useful is the join with point-of-sale data. Three details decide whether that join is meaningful.
- Clocks must agree. A POS system running four minutes behind the counting platform will shift late transactions into the wrong hour and distort conversion at every hourly boundary.
- Returns and exchanges should be separated from sales transactions. Otherwise a busy returns day looks like strong conversion.
- Use transactions, not revenue, for conversion. Revenue per visitor is a separate and equally useful metric, but blending the two produces a figure nobody can act on.
Luksusbaby used VemCount to see hit and conversion rates in real time rather than in a weekly export, alongside visitor demographics. That distinction changes behaviour on the floor. A manager who sees conversion collapse between 15:00 and 17:00 while traffic holds steady can respond that afternoon, not after the month closes. The demographic layer, actual age and gender of visitors rather than the assumed target group, showed whether the audience in the store matched the audience in the marketing plan.
Compare like with like across stores
Raw footfall is almost useless for comparing locations. A high-street flagship and a retail park unit will never have similar visitor numbers. What can be compared:
- Conversion rate by daypart, indexed against the chain average.
- Traffic per opening hour, which neutralises the effect of different trading hours.
- Week-on-week traffic change, which isolates campaign and weather effects from structural location differences.
- Staff hours per 100 visitors, which is where roster decisions should start.
Daells Bolighus took this a step further during a turnaround, bringing in-store visitor data and online visitor data into the same view across locations. The value was not a prettier dashboard. It was the ability to see when a category was gaining interest online before that interest reached the stores, and to judge whether a weak sales week in a given location was a traffic problem or a selling problem.
When door counting is no longer enough
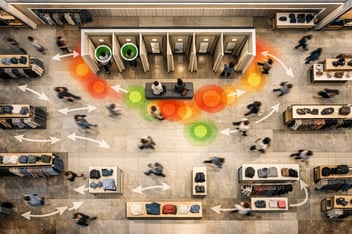
Once conversion by hour is stable and trusted, the next questions are inside the store. Which zones do visitors reach? How long do they stay in the department that carries the highest margin? Does the new layout move people past the impulse fixtures or around them? This is the territory of VemTrack, which uses AI re-identification to follow anonymised movement across camera zones and produce journey and dwell data rather than a single entrance count. It is a larger investment and should follow, not precede, disciplined footfall measurement. A retailer who cannot yet trust the door count has no basis for trusting a heat map.
Build a cadence or the data will go unread
The most common failure in retail traffic analytics is not bad sensors. It is a platform that produces excellent numbers which nobody opens after the first quarter. Assign ownership at three levels. Store managers review hourly conversion daily and adjust the floor. Operations reviews staff hours per 100 visitors weekly and adjusts rosters. Commercial and marketing review capture rate and demographics per campaign and adjust spend. If a metric has no named owner and no decision attached to it, stop collecting it.
Back to that Monday meeting. With traffic data on the table, the argument ends in about ninety seconds. Footfall was down 2%, conversion was down four points, and the drop was concentrated on Thursday and Friday evenings when the roster was thinnest. That is not a weather story. It is a staffing story, and it is fixable this week.
If you want to review how your current entrance counts are set up, validate the accuracy you are actually getting, or see how hourly conversion and demographic data would look for your locations, talk to the Vemco team about a measurement audit for your stores.