/global/header/smart-buildings.svg)


/global/header/facility-management.svg)






/global/header/leisure.svg)






Few indoor climate topics are quoted as often, or as loosely, as the link between CO2 and how well people think. The same studies appear online with contradicting numbers, and a "1,000 ppm limit" is attributed to a standard that no longer contains it. This page sets out what the original research and the main building rules actually say, with a link to each source.
What the studies found
Harvard COGfx, Allen et al. 2016
Office workers did simulated office work in a controlled environment on different days, with CO2 set at around 550, 945 and 1,400 ppm. Compared with the 550 ppm baseline, cognitive scores were on average 15% lower at 945 ppm and 50% lower at 1,400 ppm. Published in Environmental Health Perspectives. Original paper and summary by Lawrence Berkeley National Laboratory
Lawrence Berkeley National Laboratory, Satish et al. 2012
22 participants made decisions in a chamber at 600, 1,000 and 2,500 ppm, with CO2 added so that nothing else in the air changed. At 1,000 ppm, performance was moderately and significantly lower on six of nine decision-making scales. At 2,500 ppm, seven of nine scales dropped sharply, some to levels the test rates as dysfunctional; the "initiative" score, for example, fell from 20.1 to 1.4. Original paper, Environmental Health Perspectives
COGfx global buildings study, 2021
302 office workers in six countries were followed in their real offices. For every 500 ppm increase in CO2, response times were 1.4 to 1.8% slower and correct answers per minute fell by 2.1 to 2.4%. The researchers found no level below which CO2 and fine particles had no effect. Original paper, Environmental Research Letters
Ventilation and office work, Seppänen, Fisk and Lei 2006
A statistical analysis of many studies found that office work performance rises by about 0.8% for every 10 cfm (4.7 l/s) per person of extra ventilation, for starting rates between 6.5 and 14 l/s per person, with smaller gains above that. Summary by Lawrence Berkeley National Laboratory
World Green Building Council, 2014
The report "Health, Wellbeing and Productivity in Offices" concludes from the research it reviewed that better indoor air quality can improve productivity by 8 to 11%. WorldGBC
What the rules say
- ASHRAE Standard 62.1 (US) does not set a CO2 limit. The 1,000 ppm value was in the 1989 edition as a marker for body odour, not health, and was removed in 1999. ASHRAE considers CO2 non-toxic up to 5,000 ppm. ASHRAE position document and NIST
- EN 16798-1 (Europe) sets design categories as CO2 above outdoor air: 550 ppm above outdoor for category I, 800 ppm for category II (the normal design level) and 1,350 ppm for category III.
- Danish building regulations, BR18 §447: in school teaching rooms, CO2 must not exceed 1,000 ppm under design conditions. For offices, the guidance allows ventilation to be designed to keep CO2 under 1,000 ppm, with occasional exceedances. BR18 §447
- UK Health and Safety Executive: readings below 800 ppm indicate a well ventilated space, and levels consistently above 1,500 ppm in an occupied room mean ventilation needs action. HSE guidance
- UK schools, BB101 (2018): mechanically ventilated classrooms should average below 1,000 ppm, and never exceed 1,500 ppm for more than 20 minutes in a row. Summary of BB101
Figures that are often misquoted
- "ASHRAE limits CO2 to 1,000 ppm." Not since 1999, and the value was never a health limit.
- "Harvard found an 11% drop at 1,000 ppm." This mixes two studies. The 1,000 ppm test point is from the Berkeley study; Harvard tested 945 and 1,400 ppm.
- "Cognition halves at 2,500 ppm (Harvard)." The 2,500 ppm test point is from Berkeley. Harvard's 50% figure is at 1,400 ppm compared with 550 ppm.
- "Poor indoor air costs US businesses 56 billion dollars a year." We could not find the original study behind this figure.
What this means for a building
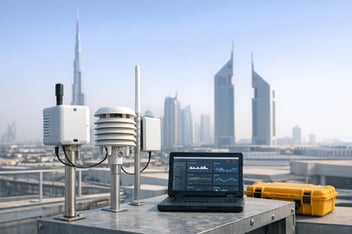
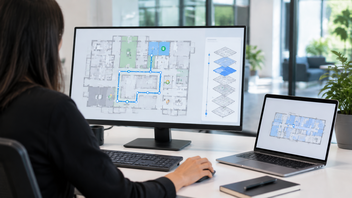
The studies agree on direction more than on exact numbers: rooms that fill up without enough fresh air make people slower and less sharp, and meeting rooms get there fastest. Continuous CO2 and occupancy measurement per room shows where and when that happens, so ventilation can follow real use instead of a fixed schedule, which also saves energy in rooms that stand empty. Read how space and indoor climate data work together.
Last reviewed September 2026. If you spot a newer study or an error, tell us and we will update this page.