/global/header/smart-buildings.svg)


/global/header/facility-management.svg)






/global/header/leisure.svg)







Sales trainer Joe Verde once surveyed 3,555 salespeople and found something uncomfortable: they reported speaking with about four people per working day across roughly 25 days — around 100 opportunities a month — while logging closer to 50. That single gap explains why the industry's beloved 20 percent closing ratio is so widely quoted and so rarely true. If half the traffic never enters the denominator, the ratio doubles on paper. You are not closing at 20 percent. You are logging at 50 percent.
This is not a small bookkeeping quirk. Every downstream decision — desk staffing, floor coverage, ad spend attribution, sales manager bonuses — sits on top of that denominator. When the denominator is wrong, everything built on it inherits the error, and usually in the flattering direction.
The up log was never a measurement tool
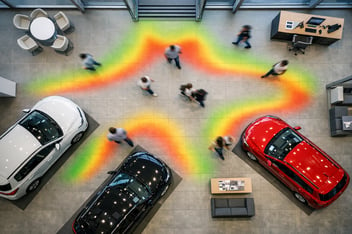
The up log is a self-reported document filled in by the people whose performance it measures. Nobody designed it as a traffic instrument; it evolved as a queue-management sheet. Salespeople have every incentive to log the promising visitor and skip the tyre-kicker, the parts customer who wandered through the showroom, the couple who left after eight minutes without being greeted. A US showroom-traffic vendor reports that dealers who compare counted traffic against their up log typically find a gap of 15 to 25 percent — visitors who physically walked in and were never recorded anywhere.
Here is why that gap matters more today than it did fifteen years ago. McKinsey research found buyers now visit an average of 1.6 dealerships before purchase, down from about five a decade earlier. A DMEautomotive survey of 2,000 car buyers found 68 percent visit two dealerships or fewer, and 40 percent visit only one. The person walking through your door has already done the research online, shortlisted your store, and in many cases arrived intending to buy from someone that week. An unlogged visitor in 2010 was one of five stops. An unlogged visitor today may have been the sale itself, walking out.
What a corrected denominator actually changes
Run the arithmetic on your own store. Suppose your up log shows 400 visitors last month and you delivered 80 units — a 20 percent closing ratio that looks respectable in any twenty group. Now apply the mid-point of that 15 to 25 percent logging gap. Real traffic was closer to 480. Your true closing ratio is under 17 percent, and roughly 80 people entered your showroom last month without ever becoming a name in your CRM. Those 80 are not a rounding error. They are your cheapest source of incremental units, because you already paid the marketing cost to get them in the door.
General managers tend to react to this in one of two ways. The defensive reaction is to argue the uncounted visitors were low quality. The productive reaction is to ask a sharper question: which hours and which days produce the gap? In most stores the answer is depressingly consistent — Saturday between 11:00 and 14:00, when the floor is saturated, and weekday lunch windows, when coverage is thin. The gap is not random. It is structural, and structural problems can be scheduled away.
Why counting a showroom is harder than counting a shop
Anyone who has actually implemented traffic counting in a dealership will tell you the hard part is not the visitors — it is the staff. Salespeople walk in and out constantly: out to appraise a trade-in, back in, out to a demonstration car, back in with the customer, out again to the delivery bay. A naive door counter can inflate traffic by a large margin on staff movement alone, which destroys trust in the data before the first monthly review. This is the practitioner detail that separates dealership deployments from ordinary retail ones, and it is why UWB staff tags matter: they exclude employee movements from the visitor count automatically, so the number on the dashboard reflects customers and only customers.
Vemco Group has been building this kind of measurement since 2005, and the platform is sensor-agnostic — it works with Xovis, Milesight, Elsys, Hikvision, Axis and Irisys hardware, which matters if your dealer group already has cameras or counters installed at some rooftops. The 3D sensors break entries and exits down by hour, weekday and weekend, and the data lands on the dashboard roughly two seconds after someone crosses the line, hosted on AWS in EU-Frankfurt. Accuracy is contractually guaranteed at a minimum of 96 percent, and typically runs 98 to 99 percent when lighting, showroom layout and visitor behaviour allow. That contractual floor is worth noting: an up log with a 15 to 25 percent gap is not competing with perfection, it is competing with a number you can hold a vendor to.
Three ratios that only exist with counted traffic
- Greeting rate: counted visitors versus logged ups. This is your real front-line coverage metric, and it should be reviewed by hour, not by month, because the failures cluster in specific windows.
- Offer rate: counted visitors versus offers issued. Comparing traffic against offers issued shows whether a slow month was a traffic problem or a floor problem — two conditions with completely different fixes and completely different costs.
- Staffing alignment: counted traffic versus scheduled salespeople per hour. Most stores staff to habit, not to demand. The mismatch is usually visible within the first two weeks of data.
There is a fourth dimension worth watching. A 2026 automotive buying-friction study found 64 percent of customers complete the purchase when the process takes under two hours, while 58 percent of shoppers encountered a problem at the dealership during 2025. Unlogged visitors and slow, understaffed peak hours are two symptoms of the same disease: the store does not know its own demand curve. Real-time alerts — via app, email, WhatsApp, SMS or webhook — let a sales manager react to a traffic surge while the customers are still on the floor, not discover it in Monday's report.
The number your twenty group should be asking about
A closing ratio built on the up log measures how well your salespeople close the people they chose to record. A closing ratio built on showroom traffic counting measures how well your store converts the demand it actually received. Only the second number tells you where the money is leaking, and with more than 60 million people counted every day across 55,000+ installations in 98+ countries, this is measurement infrastructure retail has trusted for two decades — the automotive showroom is simply late to it.
If you want to see the real gap between your up log and your actual showroom traffic — and what your true closing ratio looks like once staff movement is filtered out — talk to Vemco Group about a dealership traffic counting pilot at vemcogroup.com/contact-us. Bring last month's up log. The comparison usually takes less than one sales meeting to change the conversation.