/global/header/smart-buildings.svg)


/global/header/facility-management.svg)






/global/header/leisure.svg)






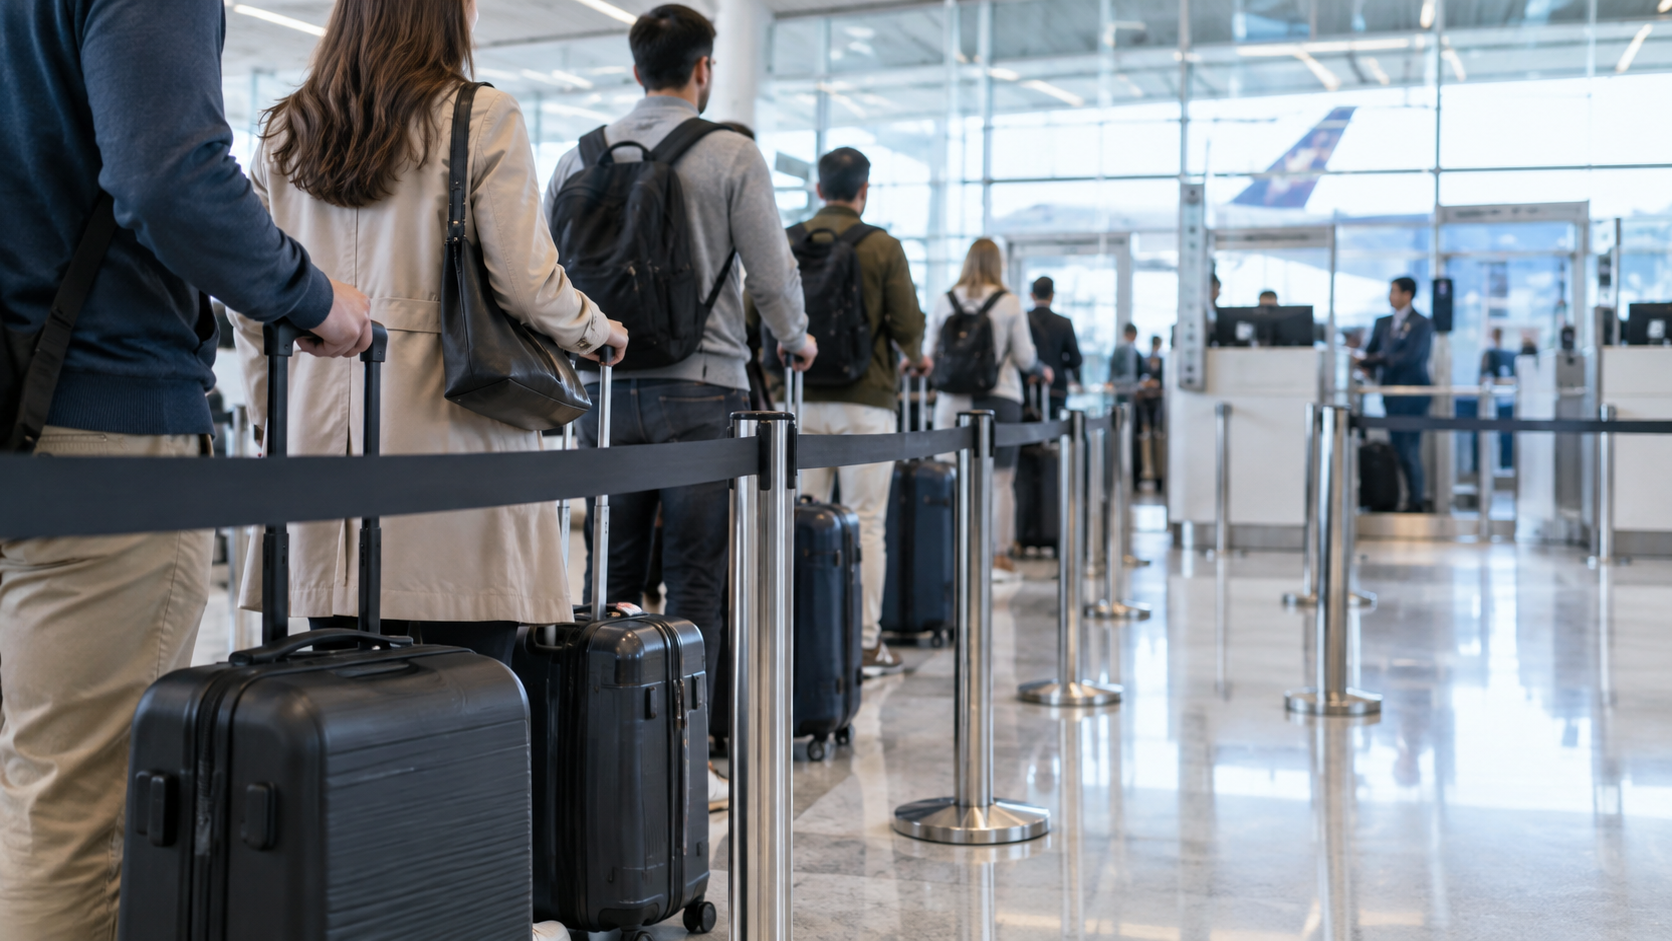
At 05:40 the security hall looks calm on the CCTV wall. By 06:10 the queue has folded twice past the stanchions, spilled into the check-in concourse, and the first complaint has reached the duty manager. Nobody counted the queue. Someone glanced at it, judged it acceptable, and the gap between that glance and the actual service rate turned into a 35-minute wait that no one saw building. That is the problem queue counting exists to solve, and it is worth being precise about what the technology actually measures, because "queue counting" is a slightly misleading name.
The two numbers behind every queue
A queue is described by two measurements, not one. The first is occupancy: how many people are inside the queue zone right now. The second is throughput: how many people leave the queue zone per minute, which is effectively the service rate of the lanes that are open. Divide the first by the second and you have an expected wait. A queue with 120 people in it and six lanes clearing 15 people a minute each is an eight-minute wait. The same 120 people with two lanes open is a 40-minute wait. The queue looks identical from the mezzanine in both cases.
This is why a people counting system on its own, fitted at the terminal doors, tells you almost nothing about queues. Door counts give you arrivals into the building. They do not tell you how many of those arrivals are standing between stanchion A and lane 4, nor how fast lane 4 is clearing them. Queue counting technology is a zone problem, and the sensors and analytics have to be set up as such.
Sensor placement: entry, exit and the space in between
There are two broad ways to instrument a queue. The lean approach places overhead counting sensors at the queue entry and at the point of service, and calculates occupancy as the running difference between the two. It is cheap, it is accurate as long as both counting lines are well placed, and it gives you throughput directly. Its weakness is that it knows nothing about what happens between the two lines. If the queue tail moves, if a passenger walks away, if staff open a bypass lane for families, the occupancy drifts and needs periodic resetting.
The fuller approach covers the whole queue area with overlapping overhead sensors and tracks movement across the entire zone. This is where anonymous movement analytics earns its keep. VemTrack, for example, sits on top of counting and adds dwell time, zone-to-zone flow and queue detection, all drawn directly onto the floorplan. Instead of inferring occupancy from two lines, you measure how long each anonymous track actually spent inside the zone, and you see where the queue physically is, not where you assumed it would be.
Outdoor queues follow the same logic but need different hardware. Taxi ranks, coach bays and forecourt drop-off zones are exposed to rain, glare and temperature swings, and a sensor rated for a ceiling in departures will not survive a winter on a canopy. Weather-resistant units with coverage up to around 20 metres allow a single sensor to take in a full rank or bay, which keeps the installation cost sane on a transport hub with a dozen external queue points.
Drawing the zone: where does the queue start?
This is the step that implementers get wrong most often, and it has nothing to do with sensor quality. On a quiet morning the queue starts at the first stanchion. At peak it starts somewhere near the information desk, and the people standing there are definitely queuing even though they are outside anything you would call a queue area. If the zone is drawn to the stanchion footprint, your occupancy figure is capped at the stanchion capacity and your wait-time estimate collapses exactly when you need it most.
Good practice is to draw a primary queue zone and a spill zone behind it, then treat anyone in the spill zone who is moving slowly or standing still as part of the queue. Dwell-time thresholds do this work: a person who has been in the spill zone for 90 seconds is queuing; a person who crossed it in eight seconds was walking to the toilets. Funnel analysis then shows what proportion of people entering the spill zone actually reach the service point, which exposes reneging, the passengers who look at the line and leave. On a public sector facility such as a passport office or a benefits counter, reneging is often the single most useful number, because it is the demand that walked out of the building unserved.
A practitioner's note on moving stanchions
Anyone who has run queue counting through a real summer peak knows this one: the stanchions do not stay where the drawing says they are. Night staff reconfigure the serpentine, a contractor shifts a row to get a scissor lift through, a supervisor opens a straight lane for crew and quietly leaves it open. Each change moves the real queue relative to the zones you drew. The practical fix is twofold. Draw zones with a margin of a metre or more beyond the stanchions, and put a weekly five-minute review of the heatmap into the duty manager's routine. A heatmap that shows hot pixels outside your queue zone is telling you the layout has moved before any wait-time figure does.
From measurement to wait-time estimate
There are two kinds of wait-time figure and they should never be confused on a display board. Measured wait is the dwell time of people who have just left the queue: it is exact, and it is about the past. Predicted wait is occupancy divided by current throughput: it is about the next person to join, and it is an estimate. For passenger-facing signage, a short rolling window of predicted wait, typically smoothed over a few minutes so it does not jump every time a lane pauses, is the honest choice. For operational decisions about opening lanes, the raw trend matters more than the smoothed number, because you want to see throughput falling before the queue has grown.
Alerts are where queue management becomes operational rather than descriptive. A threshold on occupancy alone fires too late; a threshold on predicted wait, or on the rate of change of occupancy, gives a supervisor ten minutes to pull staff from the back office. Hub operators who run multiple checkpoints often set alerts relative to each other, so that a lane imbalance between two halls is flagged before either hall individually breaches its target.
What accuracy to expect, honestly
Counting accuracy in a queue environment is good but not magic. A contractual minimum of 96% is realistic, and installations typically run at 98 to 99% when lighting, layout and visitor behaviour allow. Queues push against that: people stand close together, carry bags at head height, and children duck under barriers. Dense occupancy is harder to count than free flow, and a vendor who quotes a flat 99% for a packed serpentine without caveats has not stood in one. Ask for the figure under peak conditions, and ask how occupancy drift is corrected.
The last consideration is scale. A single checkpoint is a project; a terminal with security, border control, baggage drop, taxi rank and a rail interchange is a programme, and the platform has to carry every zone on the same cloud infrastructure so that a duty manager sees the whole hub on one floorplan rather than six dashboards. Queue counting works best when it is one layer of a wider movement picture, feeding the same data that shows path, flow and dwell across the entire building.
Frequently asked questions
How does queue counting work? Overhead sensors detect people anonymously and the software tracks how many are inside a defined queue zone and how quickly they leave it towards the service point. Occupancy divided by throughput gives a predicted wait, while the measured dwell time of people who have just been served gives the actual wait. Zones, thresholds and alerts are drawn on the floorplan so the figures match the real queue, not the one in the drawings.
If you are planning queue counting for a security hall, a border checkpoint or an outdoor rank and want to talk through sensor placement, zone design and what accuracy is achievable under your peak conditions, contact Vemco Group at https://vemcogroup.com/contact-us and we will walk through your floorplan with you.