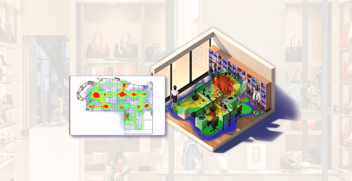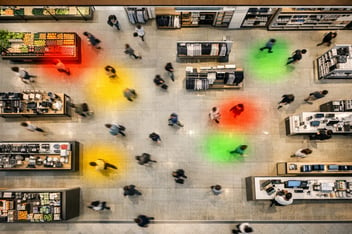









An optical store in Sweden counted every visitor through both of its entrances, every day, with good accuracy. What it did not know until autumn 2026 was that a large share of those visitors never stood in front of its brand walls at all. They walked to the vision center, waited, sat down for a fitting and left. The frames the store paid to display at eye level were, for many visits, scenery. That gap between "how many came in" and "what they did inside" is exactly what in store customer tracking closes, and this article walks through a real VemTrack proof of concept to show what the data looks like and what a store team does with it.
Twenty zones on one floor plan
The POC store had two entrances and a floor plan divided into roughly twenty zones: the entrances themselves, a vision center, a help desk, a ticket point, a waiting area, four seating areas used for eye tests and fittings, campaign tables at each entrance, brand walls, a wearables section, sunglasses and several other displays. Overhead sensors fed VemTrack, which turned the movement into a handful of views the store team actually used:
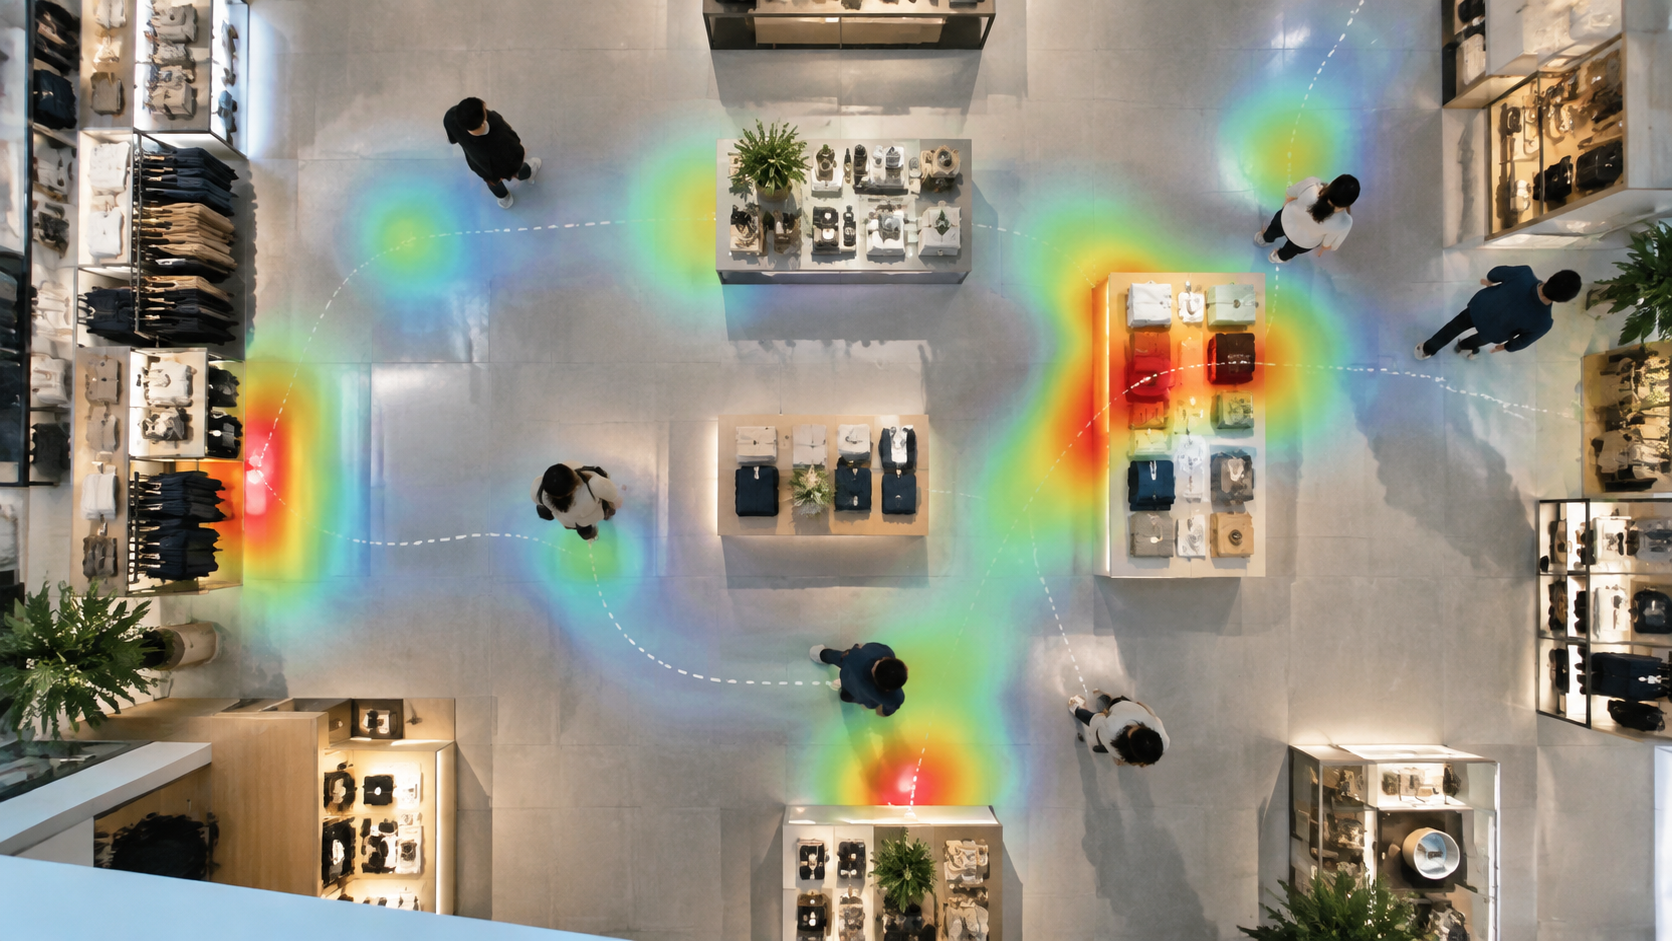
- A store heat map showing where visitors spent time over any chosen period.
- Flow from each entrance: which zones visitors went to next, and in what proportion.
- Entrance statistics with total and daily visitors per door, change versus last week and an estimated gender split.
- Peak hours by weekday and hour.
- Top customer paths through the store, each with its share of all journeys.
- A zone visits ranking and average dwell time per zone.
- Estimated gender and age distribution.
- A single visitor journey view: an anonymous numeric ID with entry time, exit time, visit length, longest dwell zone, zones visited and a timeline.
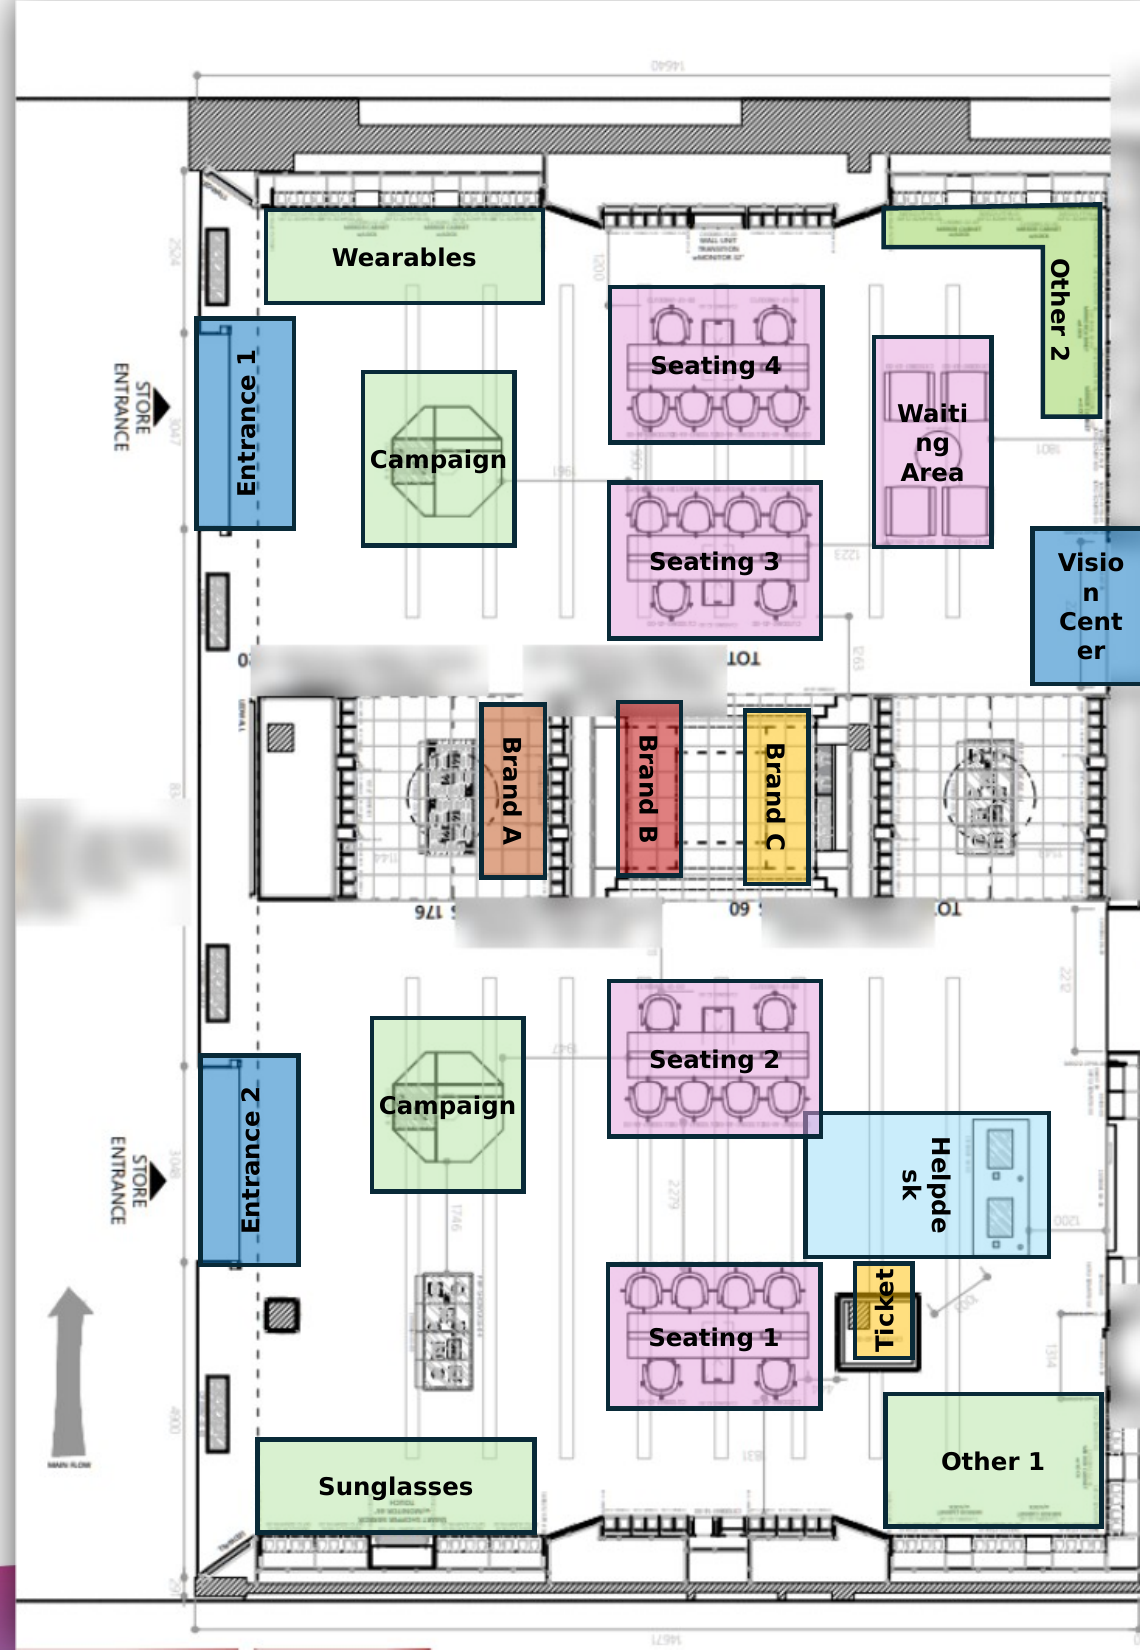
The POC floor plan: entrances, vision center, help desk, seating areas and displays drawn as zones.
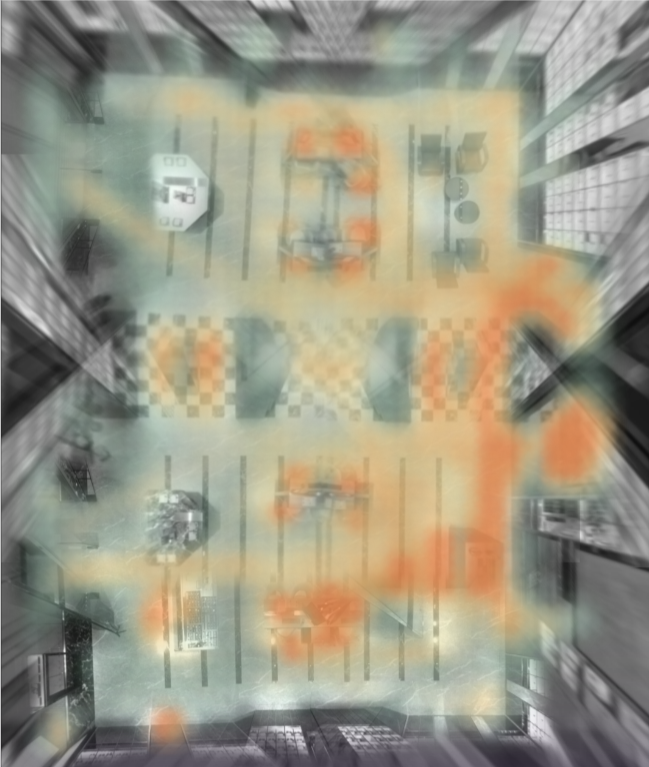
Store heat map: where visitors spent time over the chosen period.
None of this identifies anyone. Visitors appear only as numbers and estimated demographics. For a store manager that is enough; the question is never "who was visitor 4471" but "why do so many visitors shaped like 4471 skip the sunglasses display".
Two entrances, two different stores
The first thing the customer flow analysis made obvious was that the two entrances behaved like two separate stores. Visitors through one door went predominantly to one set of first zones; visitors through the other door went somewhere else, and the estimated visitor mix differed between them as well. The campaign tables had been placed symmetrically, one per entrance, on the assumption that entrances are interchangeable. They are not. If flow from entrance B bends left towards the help desk, a campaign table positioned for a straight-ahead walk is in the wrong place by a few metres, and a few metres is the difference between being seen and being passed.
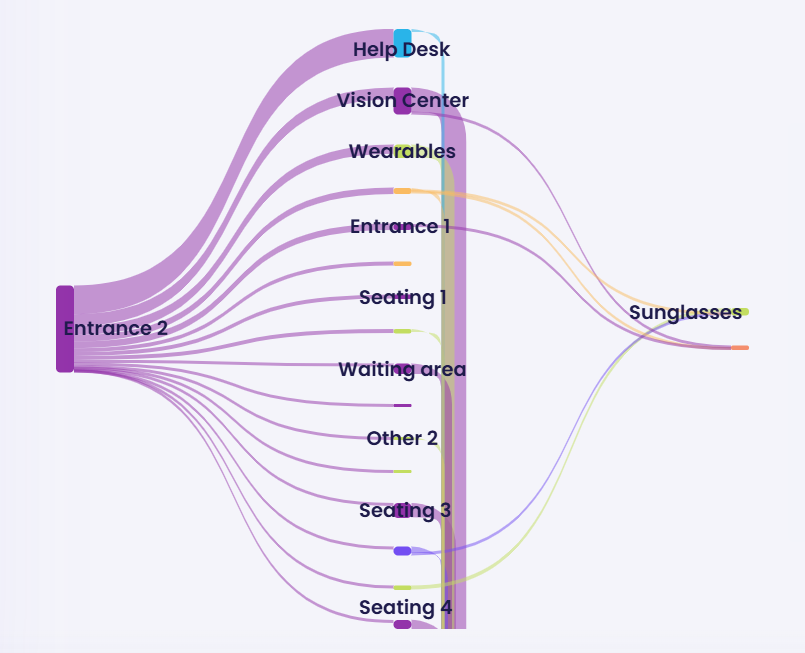
Flow from one entrance: which zones visitors went to next.
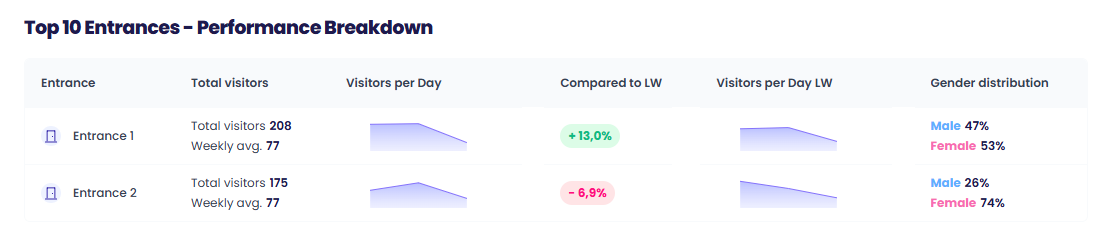
Entrance statistics per door.
This is the most immediate use of the flow view: move the campaign table to where the first few seconds of the shopper journey actually go, then check next week whether its zone visits and dwell moved with it.
Where the time goes: dwell time retail teams can act on
The zone ranking and the retail heat map agreed: the vision center and the help desk were the most visited zones in the store. That is the business, so no surprise. The seating areas, however, held visitors longest, typically around five minutes on average, because that is where fittings and consultations happen. Short, high-volume zones and long, lower-volume zones tell different stories, and a heatmap alone can blur them, which is why the per-zone dwell table sits next to it.
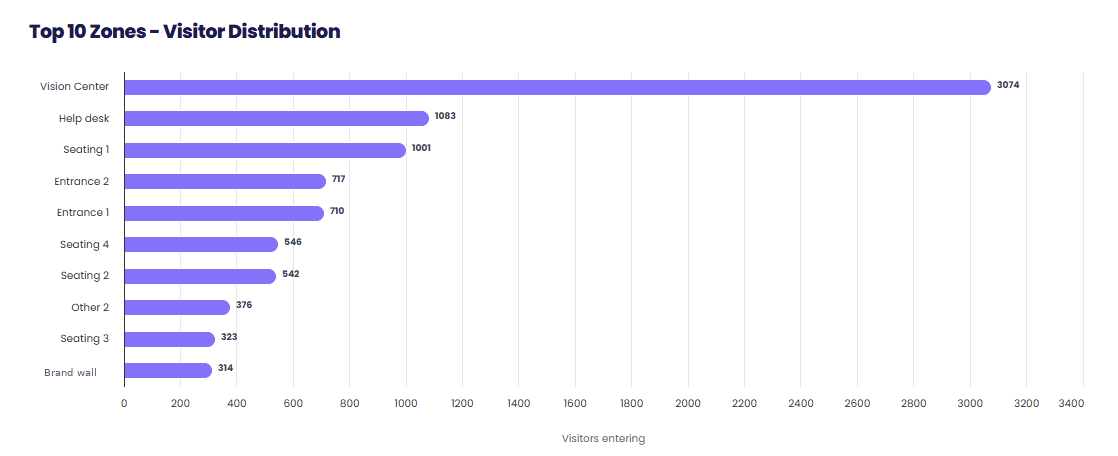
Zone visits ranking.
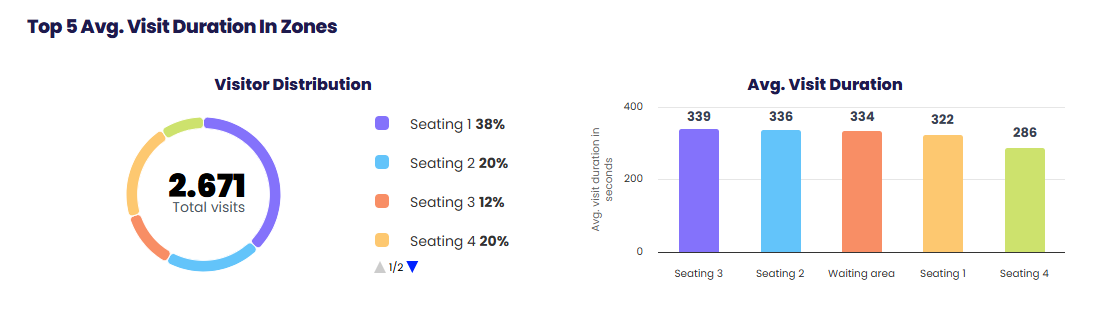
Average dwell time per zone.
The help desk is where dwell becomes a service metric. If average dwell at the help desk climbs on Saturday afternoons while dwell in the seating areas stays flat, people are queuing, not being served. Tracking turns "time to service" from an anecdote into a number per weekday and hour, and the single journey view lets a manager pull a specific long visit and see whether the time was spent waiting at the ticket point or sitting in a fitting.
Customer path analysis and the brand wall problem
The top paths view lists the most common sequences of zones and the share of all journeys each one represents. In the POC the dominant paths ran entrance, vision center or help desk, seating area, exit. Brand walls appeared in far fewer journeys than the service zones did. That is not a tracking finding, it is a merchandising question: are the walls positioned off the natural path, is the frame assortment the problem, or is the store simply a service destination where frames are chosen at the seating area with an optician rather than browsed on a wall?
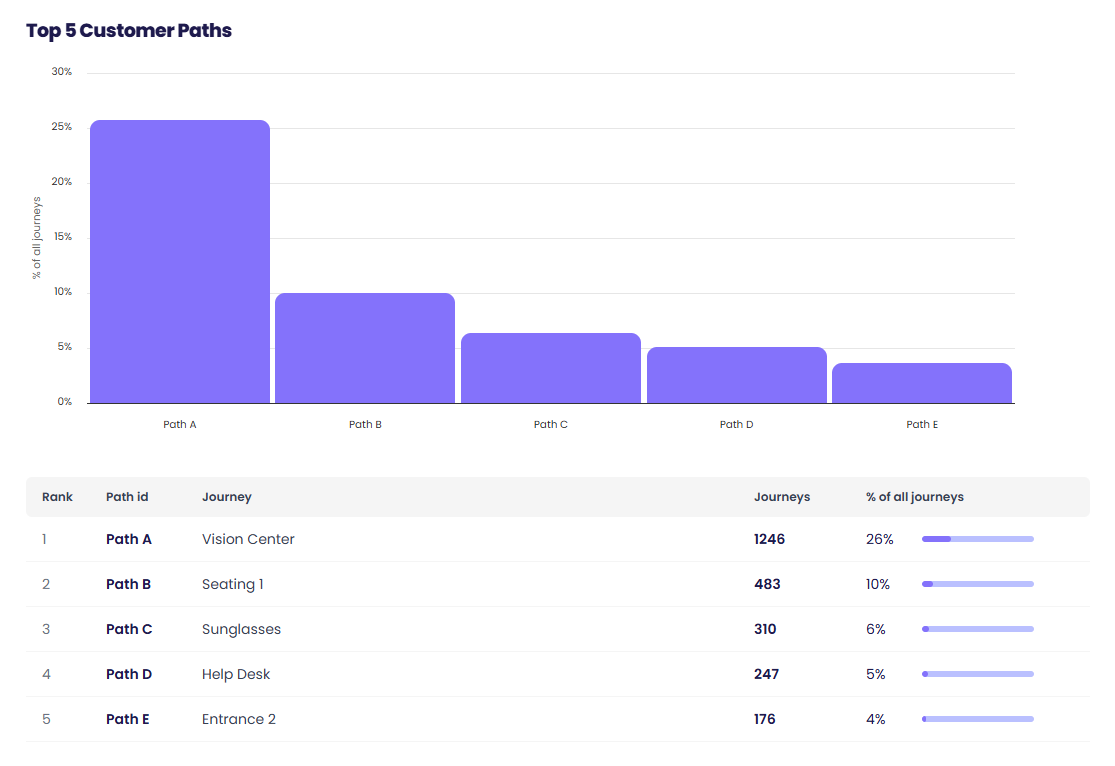
Top customer paths and their share of all journeys.
Whichever answer the category manager lands on, the test is the same: change one wall, hold the others, and compare zone visits and dwell for the following weeks. Without in store analytics that comparison is impossible; with it, it is a filter on a date range.
Peak hours and the 17:00 cliff
Peak-hour data by weekday and hour showed a clear drop in visitors after 17:00, with afternoon and evening tailing off faster than the staff roster assumed. For an optical store, where a fitting ties up an optician and a seat for several minutes, staffing to footfall is not enough; you staff to seating-area demand. Knowing that seating dwell peaks mid-afternoon on specific weekdays lets the store put opticians where fittings happen and shift administrative work to the quiet hours after five. The same view, run across several stores, shows which locations share a rhythm and which need their own roster.
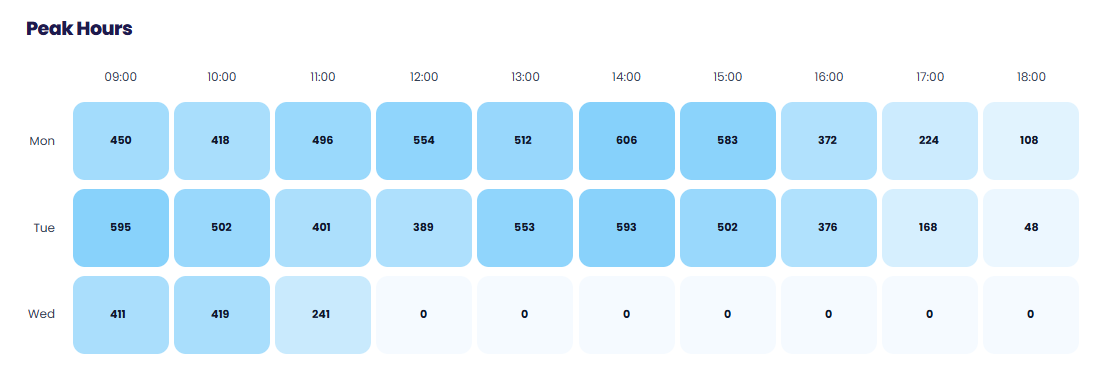
Peak hours by weekday and hour.
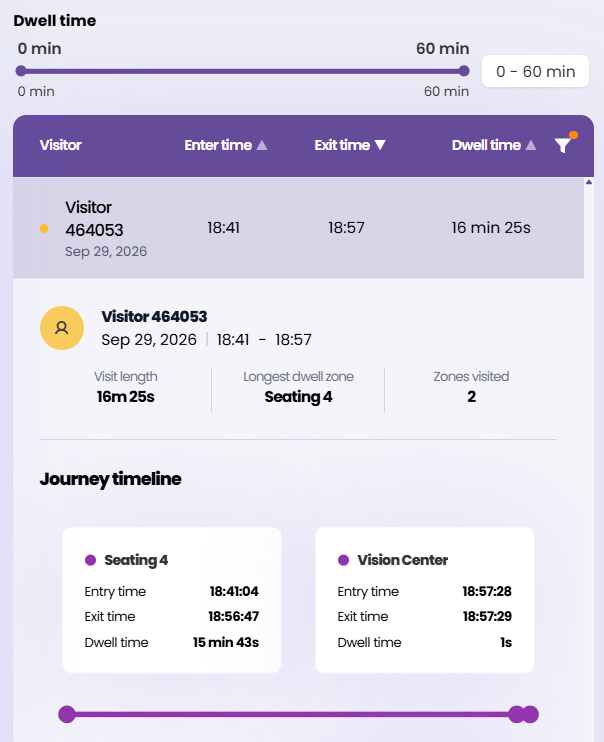
A single anonymous visitor journey with zones and dwell times.
One thing implementers learn early
Zone drawing decides the quality of everything downstream. The temptation is to trace zones around fixtures. The better practice is to draw them around where a decision or a service event happens, leave a small buffer between adjacent zones so a visitor standing between two brand walls is not counted as bouncing between them, and define a minimum dwell threshold so that someone walking through a zone on the way to the help desk does not register as a visit. Every store in a chain should use the same zone taxonomy, otherwise comparing stores compares drawings rather than behaviour.
People counting versus in-store tracking
People counting with VemCount answers how many people entered, when, and how that converts against POS. Vemco Group has done this for more than 20 years across 55,000+ installations in 98+ countries, counting 60+ million people a day. Contractually the accuracy minimum is 96 percent; in practice it is typically 98 to 99 percent when lighting, layout and visitor behaviour allow. In-store tracking with VemTrack answers what happened between the door and the exit. Both run on the same Vemco platform, so the entrance counts, the zone data, POS and, in mall settings, tenant data sit in one retail analytics environment rather than three exports.
Frequently asked questions
What is in-store customer tracking? It is the measurement of how visitors move through a store once they are inside: which zones they enter, in what order, and how long they stay. Overhead sensors feed a floor plan divided into zones, producing heatmaps, paths and dwell times rather than just a door count.
How do stores track customers without identifying them? Each visitor is represented as an anonymous numeric ID with timestamps and zones visited, plus an estimated gender and age bracket. No names, faces or device identifiers are stored in the analytics, so the output describes patterns, not people.
What is dwell time in retail and why does it matter? Dwell time is the average time visitors spend in a defined zone. It separates zones people pass through from zones where they engage or wait, which makes it useful both for merchandising decisions and for measuring time to service at desks and fitting areas.
What does a retail heat map show? It shows where visitors concentrated their time over a chosen period, overlaid on the floor plan. Read alongside zone visits and dwell, it distinguishes high-traffic, short-stay areas from low-traffic, long-stay areas.
What is the difference between people counting and in-store tracking? People counting measures entries and exits at the door and supports conversion and footfall trends. In-store tracking measures behaviour between those two points. On the Vemco platform both share one data model, so door counts and zone behaviour can be analysed together.
If your chain already counts footfall and you want to see what a twenty-zone VemTrack map of one of your own stores would reveal about entrance flow, dwell at service points and brand wall performance, start a 60-day free trial, rent the sensors with no upfront investment, or book a demo or a proof of concept and we will scope it around your floor plan.