/global/header/smart-buildings.svg)


/global/header/facility-management.svg)






/global/header/leisure.svg)






Two stores in the same chain post identical weekly sales. The regional manager treats them the same way in the Monday review. But one of them had 40% more people walk through the door. Judged on revenue alone, they look equal. Judged on what each visitor was worth, one store is quietly outperforming and the other is leaking opportunity every single day. That gap is exactly what store performance analytics exists to expose, and it is why sales reports on their own have become a poor basis for budget decisions.
Why revenue is the wrong starting point
Revenue is an outcome. It tells you nothing about the mechanics that produced it. A store can grow sales because a competitor closed nearby, because a marketing campaign pulled in traffic, or because the team on the floor genuinely got better at converting. Each of those explanations calls for a completely different management response, and without foot traffic data you cannot tell them apart.
The retail KPIs that actually explain performance sit one layer below revenue:
- Traffic: how many people entered, by hour, day and entrance.
- Conversion rate: transactions divided by visitors. In most physical retail this sits between 15% and 40%, and a two-point movement is a big deal.
- Sales per visitor: the single best measure of how well a store monetises the demand it receives.
- Shopper-to-staff ratio: visitors per staff hour, which shows whether labour was where the customers were.
- Dwell time and zone engagement: how long people stay and which areas they actually visit.
Put those next to revenue and the two stores from the opening no longer look identical. One has a conversion problem. The other has a traffic problem. Those are fixed with different levers and different budgets.
Getting the measurement right before anything else
Every KPI above depends on the visitor count being credible. If staff doubt the number, they will dismiss the conversion rate that follows from it, and the whole programme stalls. A modern retail traffic counter using 3D stereo or AI-based sensors should deliver a contractual minimum of 96% accuracy, and typically 98 to 99% when lighting, store layout and visitor behaviour allow. Be sceptical of anyone promising a flat 99% regardless of conditions; a glass façade with strong backlight or an entrance where people linger in groups will behave differently from a clean, well-lit doorway.
Here is something implementers learn quickly and vendors rarely put in the brochure: the biggest accuracy loss in most stores is not the sensor, it is staff. Employees walking in and out for deliveries, breaks and trolley runs can inflate traffic by 5 to 10% in a small store, which silently drags conversion down. Good deployments exclude staff through dedicated entrances, filtering, or counting lines placed past the staff corridor. If your conversion looks oddly low at opening and closing, check this first before you blame the sales team.
How to measure foot traffic in a store properly
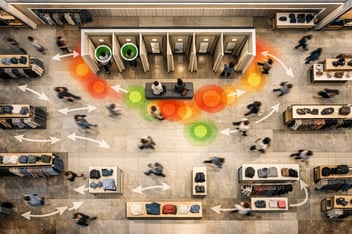
Measuring entrances is the baseline. Mature foot traffic analytics goes further and treats the store as a set of zones. A sensor at the door tells you demand; sensors over departments tell you where that demand went. This is where customer journey analytics starts to pay for itself. If 60% of visitors enter, turn left and never reach the back third of the floor, no amount of merchandising in that back third will perform, and you now have evidence to redesign the layout rather than an opinion.
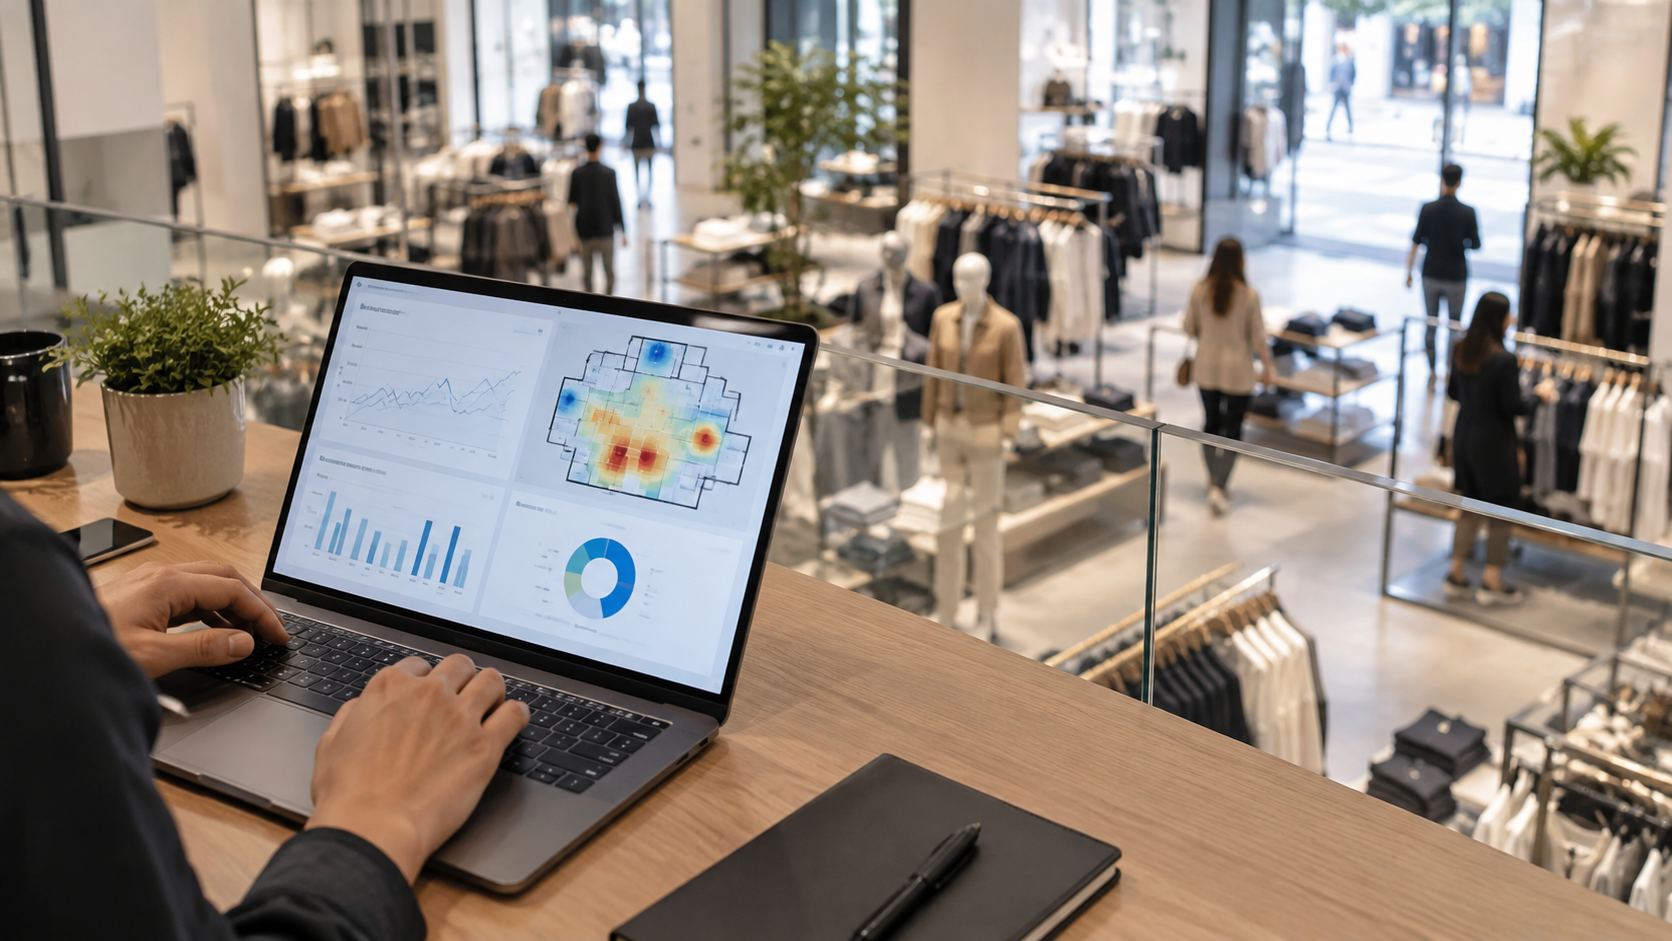
Retail heat mapping makes this visual and, more importantly, makes it persuasive to people who do not read spreadsheets. Store managers respond to a floor plan with cold and warm zones in a way they never respond to a table of dwell times. Tools such as VemTrack add movement paths and anonymous AI re-identification, so you can follow the journey from entrance to zone to till without storing any personal data, which keeps GDPR conversations short.
Turning data into decisions that stick
The retail analytics programmes that fail are the ones where data lands in a head-office dashboard and never reaches the floor. The ones that work give the store manager a short list of weekly actions tied to numbers they recognise. Three uses deliver the fastest payback:
- Staff scheduling against traffic curves. Most stores schedule for the week's sales pattern, not the visitor pattern. Traffic often peaks an hour or two before sales do. Moving a shift forward can raise conversion without adding a single labour hour.
- Marketing attribution. A campaign that lifts traffic 20% but leaves conversion flat is a reach success and a store execution problem. Separating the two stops marketing and operations arguing about whose fault a weak week was.
- Comparing stores fairly. Ranking stores on sales per visitor rather than raw revenue surfaces strong managers in small locations and underperformers in flagship sites.
Luksusbaby is a useful example of the first point. The children's fashion retailer used VemCount to watch conversion rate in real time alongside visitor demographics, so decisions about staffing and campaign targeting were made on who was actually in the store that day, not on a quarterly customer survey. Demographic insight of this kind lets marketing confirm whether a campaign aimed at one age group actually pulled that group through the door.
Daells Bolighus shows the multi-location version. During a turnaround, the home furnishings chain combined in-store visitor data with both in-store and online sales across its locations. That gave leadership a single view of demand and conversion per site, which is what you need when deciding where to invest, where to restructure and where to hold.
Choosing a retail analytics platform without overbuying
Executives tend to ask about dashboards. The better questions are about integration and governance. Can the platform pull transaction data from your POS automatically so conversion rate retail figures update without manual exports? Does it handle multiple entrances, staff exclusion and opening-hours filtering per store? Can regional managers see their own stores while head office sees the chain? And can you start with door counting in ten stores and add zone analytics later without replacing hardware?
A phased approach is almost always right. Prove the traffic and conversion numbers first, get store managers to trust and use them, then expand into journey and heat mapping where the layout questions justify the cost. Buying the full stack on day one usually produces a lot of unread reports.
Frequently asked questions
How to increase foot traffic in a retail store? Start by measuring current traffic by hour and day so you know which windows are weak, then target those windows with local marketing, events, extended hours or click-and-collect promotions. Measure traffic again after each initiative so you know what actually moved the number rather than what you assume did.
How to measure foot traffic in a store? Install 3D or AI-based people counters above each entrance, configure them to exclude staff movement, and connect the counts to your POS data so conversion is calculated automatically. Validate accuracy with a manual count during the first weeks; a good installation should reach 98 to 99% under normal conditions and never fall below the contractual 96%.
If you want to see what your stores' conversion and sales per visitor really look like, and where the first scheduling or layout wins are hiding, talk to the Vemco team about a store performance analytics pilot in a handful of locations.