/global/header/smart-buildings.svg)


/global/header/facility-management.svg)






/global/header/leisure.svg)







Walk into most dealer group budget reviews and you will find a strange asymmetry. The showroom, which handles the minority of physical visits, is measured, benchmarked and discussed in every meeting. The service drive, which a YouGov survey of US consumers identified as the single most common reason for visiting a dealership — 45 percent of recent visitors, ahead of test drives at 36 percent and browsing at 33 percent — is tracked almost entirely through repair orders. And an RO is not a visitor count. It misses the customer who came in, saw four people ahead of them at the write-up desk, and left. It misses the waiter who sat in your lounge for two hours and formed an opinion about your store. It misses the family member who came along and wandered into the showroom.
If your fixed operations department carries the absorption rate for the whole store — and in most groups it does — then the fact that nobody counts service reception traffic the way retail counts footfall should bother you more than it currently does.
Why repair orders undercount your real traffic
Service managers tend to treat ROs as a proxy for visits, and for scheduled work it is a reasonable one. But it breaks down in exactly the situations that matter most for revenue and reputation:
- Walk-aways. A customer who arrives without an appointment, judges the queue, and drives off never generates an RO. Your DMS says that person does not exist. A people counter at the service reception says they arrived at 8:12 and were gone by 8:19.
- Accompanying visitors. Spouses, kids, colleagues who dropped the driver off. They occupy your lounge, use your coffee, and sometimes browse your used inventory. One RO, three visitors, zero measurement.
- Return trips. The pickup visit is a second physical interaction with your store, often the one where the invoice conversation happens. It shares the same RO as the drop-off, so it vanishes from any RO-based view of traffic.
The gap matters commercially because service visits are where loyalty is actually decided. An experience agency survey of 1,200 recent car buyers found nearly half of customers felt more positive about a dealership after a service visit — while 80 percent actively warned others away after a bad one. That asymmetry is brutal. And with McKinsey research showing buyers now visit an average of 1.6 dealerships before purchase, down from about five a decade earlier, the service lane is frequently the only recurring physical touchpoint you get between purchase cycles. You cannot manage an experience you cannot see arriving.
Counting the service drive is not the same as counting a showroom door
This is where generic footfall advice falls apart, and where implementations succeed or fail. A showroom entrance is a clean counting problem: a door, a flow of customers, occasional staff crossings. A service reception is the opposite. Advisors and technicians cross the reception line dozens of times per shift — walking cars in, retrieving keys, escorting customers to the lounge. If you count them, your data is noise dressed up as insight.
The practical fix is staff exclusion. Vemco Group, which has been doing people counting since 2005, handles this with UWB staff tags that automatically strip technician and advisor movements out of visitor counts. Anyone who has audited raw counts at a busy service reception knows this is not a nice-to-have: at a mid-size store, unfiltered staff crossings can outnumber genuine customer arrivals by a wide margin during the morning rush. Here is the practitioner detail most vendors will not tell you upfront — the loaner-car handoff is the classic contaminator. An advisor walking a customer out to a courtesy vehicle and back can register as four line crossings. Tag the advisor and you count one real visitor instead.
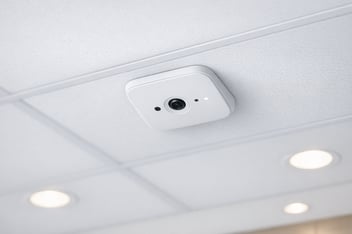
Sensor placement matters too. You want arrivals at the service reception counted separately from showroom entrances, so service traffic and sales traffic show up as distinct flows rather than one blended number that flatters nobody. A sensor-agnostic platform helps here, because service drives vary wildly in ceiling height, lighting and layout: Vemco's platform works with hardware from Xovis, Milesight, Elsys, Hikvision, Axis and Irisys, which means the sensor gets picked to fit the drive-through canopy or reception vestibule you actually have, not the one in the brochure. On accuracy, be honest with your leadership: the contractual minimum is 96 percent, with 98–99 percent typical when lighting, layout and visitor behaviour cooperate. That is more than sufficient for staffing and capacity decisions, which is what this data is for.
What a service manager actually does with the data
Three uses justify the spend on their own:
- Staffing the write-up desk against real arrival curves. Every store schedules advisors against appointment slots. Arrival data shows what actually happens — the 7:45 pre-work surge, the lunchtime pickup wave — and how far it deviates from the book. With counts landing on the dashboard roughly two seconds after a line cross, this is same-morning information, not last-month reporting.
- Catching queues while they form. Real-time alerts via app, email, WhatsApp, SMS or webhook mean a service manager on the shop floor gets pinged when reception occupancy crosses a threshold — while there is still time to pull a second advisor forward, rather than reading about the walk-away in tomorrow's CSI comments.
- Sizing the waiting experience. Waiting area occupancy tracking shows how long customers actually stay after drop-off and how full the lounge runs. If your waiters routinely sit for two-plus hours, that is a loaner fleet conversation, a lounge investment conversation, or an express-lane conversation — backed by numbers instead of anecdotes.
For dealer group operations leads, the multi-site angle is the real prize. Once every store's service reception traffic is measured the same way, you can compare arrivals-per-advisor, walk-in share and dwell times across rooftops and find out which store's process is worth copying. That comparison is impossible when each store's only traffic metric is RO count filtered through its own scheduling habits.
The infrastructure question your IT team will ask
Expect scrutiny on data handling, especially in European groups. Vemco's platform is hosted on AWS in Frankfurt, counts more than 60 million people every day across 55,000+ installations in 98+ countries, and counts people as anonymous flows — no facial recognition, no personal data. For MQTT-minded IT departments, counts can feed directly into existing dashboards and BI stacks rather than living in yet another siloed portal.
The service drive is where nearly half of your physical customer interactions happen and where loyalty is won or lost between purchase cycles. Counting it is not a retail gimmick borrowed from shopping malls — it is basic operational visibility that fixed operations has simply never been given. If you want to see what your service reception traffic actually looks like hour by hour, and what your walk-away rate really is, talk to the team at Vemco Group about a service-drive counting setup for your store or group.