/global/header/smart-buildings.svg)


/global/header/facility-management.svg)






/global/header/leisure.svg)







The marketing team reports 14,000 attendees at Saturday's brand activation. The anchor tenant, who paid a share of the cost, asks how that number was arrived at. The honest answer is a security guard with a hand clicker at the main entrance, an estimate for the car park entrance, and nothing at all for the two doors that were opened at 11:00 because the queue got long. Nobody lied. But nobody can defend the figure either, and the tenant knows it.
This is the gap event attendance tracking closes. Not by replacing the clicker with a better clicker, but by using the entrance sensors a shopping centre or venue already runs every other day of the year, and asking them a different question for the duration of the event.
Why event headcounts fall apart
Permanent footfall is relatively forgiving. If a sensor drifts two percent on a normal Tuesday, the trend over a quarter still holds. Events are different. They compress a week's worth of scrutiny into six hours, and three things routinely go wrong:
- Doors change role. Exit-only doors become entrances when crowd managers open them. Fire doors get propped. A side entrance that normally handles four percent of traffic handles thirty percent for an hour.
- The crowd behaves differently. People stand in doorways, walk in groups of six, carry children, push strollers and prams. A sensor calibrated for a steady stream of shoppers in ones and twos is being tested at the edge of its conditions.
- The build-up gets counted. Staging crews, caterers, brand ambassadors and security walk through the main doors forty times each before the public arrives. Without staff exclusion and a defined event window, several hundred phantom attendees sit in the total before the doors officially open.
Each of these is manageable. None is manageable after the event. Which is why the planning conversation matters more than the sensor model.
Three numbers, not one
Most people asking about event attendance tracking want a single total. The more useful output from an entrance counting system is three related figures, each answering a different stakeholder.
Total entries is what marketing and sponsors want. It is the headline. It should be reported alongside a baseline, meaning the same day and hours from the previous three or four weeks, so the uplift attributable to the event is visible rather than implied.
Peak and live occupancy is what the facility manager and the fire officer want. An occupancy counter subtracts exits from entries across every monitored door and shows how many people are inside the space right now. During a late-night shopping event with a licensed bar area, this is not an analytics nicety. It is the number that decides whether the doors stay open.
Arrival curve is what operations wants for next time. If 60 percent of attendees arrived in the first 90 minutes, the queue management plan was wrong, the staffing roster was wrong, and the tenant who ran a 2 pm promotion got a fraction of the audience they expected.
Running a capacity counter on a real floor plan
A capacity counter only works if every opening a person can walk through is either counted or physically closed. This sounds obvious. In practice it is where most event setups fail, because the venue drawing shows nine public doors and the day-of-event reality involves eleven.
Here is the observation most implementers learn the hard way: the sensors are rarely the weak point. The weak point is the door that was never meant to be used, opened by a well-meaning steward at the busiest moment. The fix is procedural. Before the event, walk the perimeter with the crowd manager, agree which doors are live, and tape or lock the rest. If a door must be opened on the day, the steward radios it in, and the control room notes the time. A temporary visitor counter can be added to a secondary door in an afternoon, but only if someone knew to ask.
Within VemCount, each entrance is a named counting zone, so the live occupancy figure is built from the specific doors in use rather than a whole-building total that quietly includes an unmonitored loading bay. Occupancy thresholds can be set per event, with a warning level below the hard limit so stewards slow entry rather than stop it. Staff exclusion algorithms remove badged employees and contractors from the count, which is what keeps the pre-opening build-up out of the attendee total.
Accuracy under event conditions
Anyone promising a flat 99 percent at an event has not watched a crowd surge through a double door. Vemco's contractual minimum is 96 percent, and installations typically achieve 98 to 99 percent when lighting, layout and visitor behaviour allow. Events stress all three. Dense groups, strollers, people pausing under the sensor to look for friends: these push toward the lower end of the range, and a credible report says so.
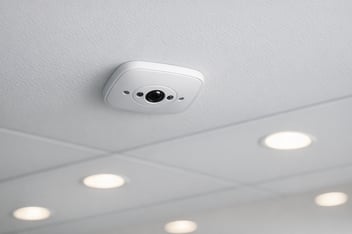
Two things help. Stereo 3D sensors, such as the Xovis units Vemco deploys as a GOLD partner, handle overlapping bodies and height variation far better than single-lens or break-beam counters, which is why they are the sensible choice for a main entrance that will see a crush. And sensor health monitoring, which flags a sensor that has gone offline, lost its calibration or shows an entry-to-exit ratio that makes no sense, means the problem surfaces during the event rather than in the report two days later. A door showing 2,000 entries and 300 exits by mid-afternoon is either a one-way flow or a fault, and the control room should know which.
Turning the count into proof
The reason to invest in event attendance tracking, rather than tolerate the clicker, is what it does to the next negotiation. A mall operator who can show a sponsor 11,400 verified entries against a 6,800 baseline, with an arrival curve and a per-door breakdown, is selling a measurable audience. A tenant who can match their own store entrance counts to the mall event window can calculate conversion uplift against POS data instead of describing the day as "busy".
Where AI sensors are in place, the same count can be split by estimated age band and gender, and children separated from adults. A family event that drew 40 percent children is a different commercial story from one that drew 10 percent, and the sponsor's brand team will want to know which.
For IT directors, the practical point is that none of this requires a separate event system. The permanent sensors, the hosted or private cloud platform and the existing POS and BI integrations carry the event as a tagged time window. The marginal cost is a planning meeting and perhaps a temporary visitor counter on a door that is normally closed.
Frequently asked questions
How do you track attendance at an event? Count every live entrance and exit with overhead sensors, exclude staff and contractors, and define the event as a fixed time window so build-up and teardown are kept out of the total. Report entries, peak occupancy and the arrival curve against a baseline from comparable days. Before doors open, confirm with crowd management which openings are in use and lock or count the rest.
If you are planning a late-night opening, a seasonal market or a sponsored activation and want attendance figures you can put in front of a tenant or fire officer without qualification, talk to Vemco about configuring your existing entrances for event attendance tracking at vemcogroup.com/contact-us.