/global/header/smart-buildings.svg)


/global/header/facility-management.svg)






/global/header/leisure.svg)






Monday trading meeting. Store A reports a strong week: more visitors than the week before, sales flat. Store B reports fewer visitors, sales up. The regional manager asks the obvious question, and nobody in the room can answer it, because the only number on the slide is the door count. That meeting is where most store traffic analytics programmes either grow up or quietly die. The sensors were never the hard part. The hard part is deciding what the count is for, and building the habits around it.
Decide what the count has to answer before you install anything
A retailer wants conversion. A shopping centre wants tenant-level footfall it can put in a lease negotiation. An airport wants dwell and queue pressure at security by quarter-hour. A university library wants occupancy against seat capacity during exam weeks. A facility manager wants to know whether the fourth floor justifies its cleaning contract. These are different questions, and they change where the counters go, how zones are drawn and which report lands in whose inbox. Write the three questions down first. If a proposed sensor position does not help answer one of them, it is decoration.
Fix the counting before you trust any ratio
Every KPI downstream inherits the error at the door. A good retail traffic counter should be contractually accurate to at least 96%, and in practice will typically run at 98 to 99% when lighting, layout and visitor behaviour allow. That last clause matters. Dark entrances, mirrored ceilings, glass vestibules where people linger, and groups walking shoulder to shoulder all degrade results, and no vendor can promise a flat figure regardless of conditions. Ask for the accuracy clause in writing, then validate it yourself with a manual count on two or three busy hours after installation. Repeat the manual check after any refit.
Here is the observation implementers learn the hard way: the most common cause of a bad conversion rate is not the sensor, it is the entrance map. A store with a customer entrance and a side door that staff use for deliveries, smoke breaks and bringing in stock will inflate traffic all day, and the conversion figure will look permanently weak. The same thing happens in centres where a tenant's back door opens onto a service corridor. Exclude staff movements, confirm which doors are genuine customer entrances, and set opening-hours filters so the cleaners at 05:30 are not counted as shoppers.
Make conversion the headline, not visitors
Raw foot traffic data tells you how many people the marketing team and the weather brought in. Conversion tells you what the store did with them. The two stores in the opening scenario make sense the moment transactions are divided by visitors: Store A got more people and lost more of them, Store B got fewer and served them better. Luksusbaby, the Danish children's fashion retailer, used VemCount to see conversion rate in real time rather than in a weekly report, which allowed store teams to react during the day, not after it, and to combine it with visitor demographics so campaigns were aimed at the age and gender profile that actually walked in rather than the one the brand assumed.
Once conversion rate retail numbers are reliable, break them down by hour. Most stores discover the same pattern: conversion collapses in the hours when visitor numbers peak because staffing was scheduled against sales, not against traffic. Moving one person from a quiet morning to the Saturday lunchtime peak is usually the cheapest improvement available, and it costs nothing beyond a rota change.
Beyond the door: journeys, dwell and retail heat mapping
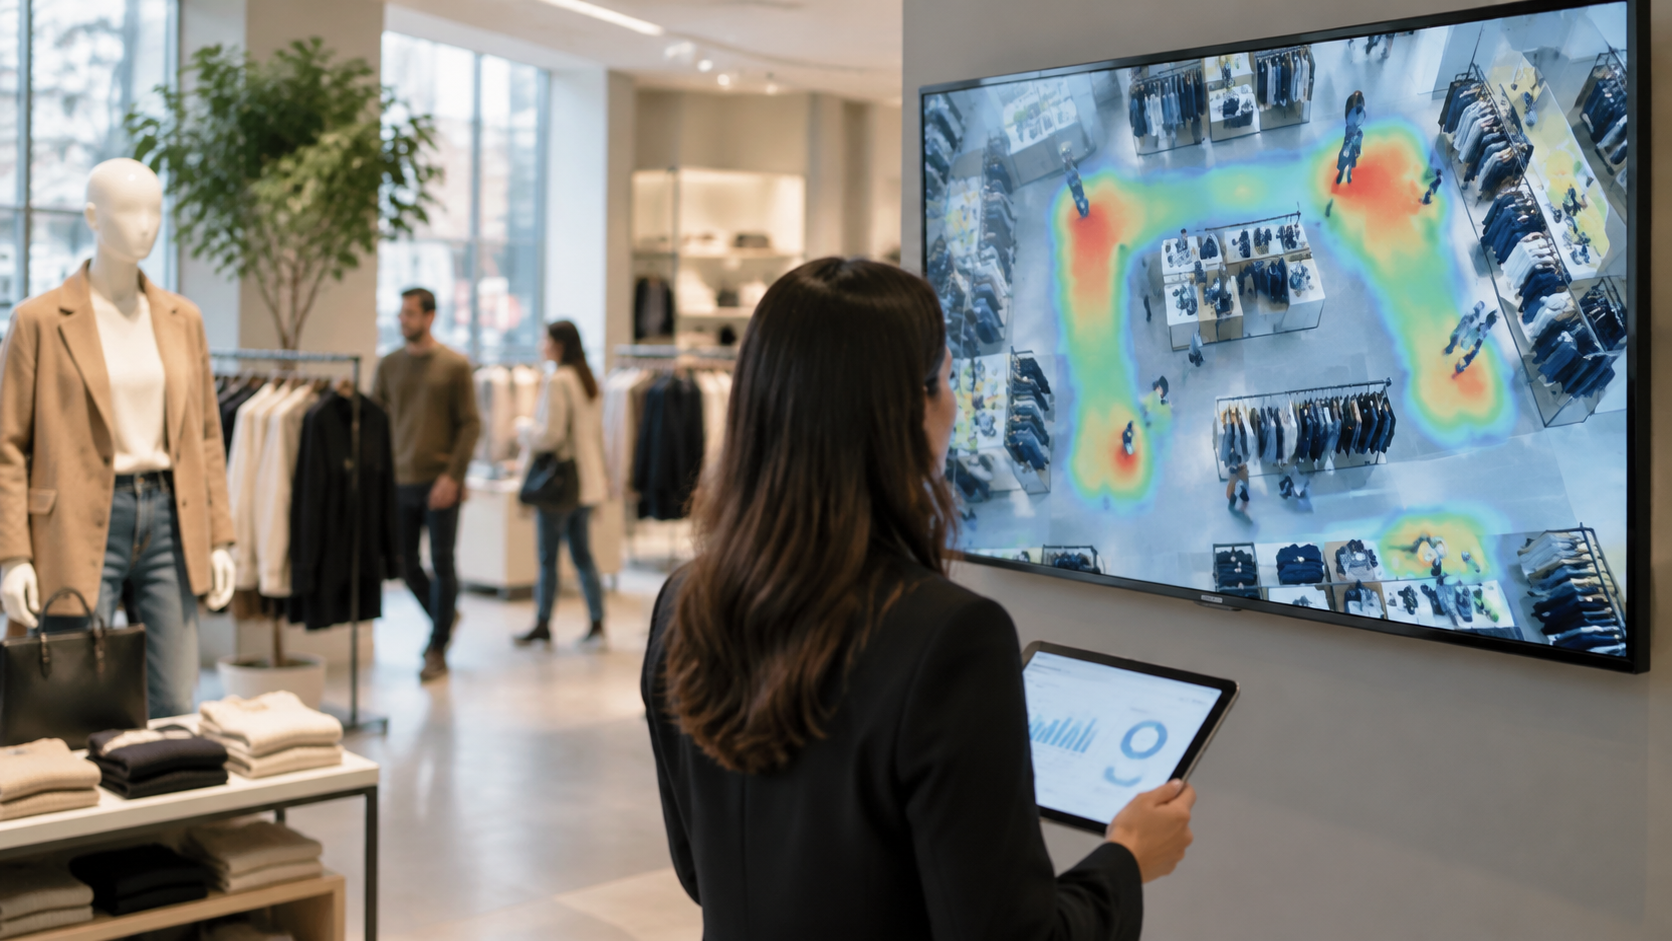
Door counts answer how many. Customer journey analytics answers where and for how long. VemTrack extends counting into movement analytics with anonymous AI re-identification, so the same visitor can be followed from entrance to zone to exit without any personal data being stored. For a retailer that means knowing whether the new promotional bay on the right-hand wall actually gets visited or whether traffic flows left and never sees it. For an airport it means dwell time airside by zone, which is what the retail concessions team needs when deciding where the next unit should go.
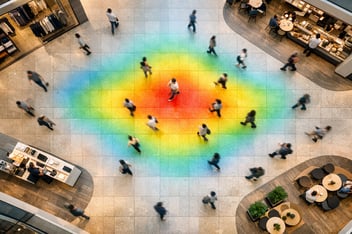
Retail heat mapping is useful, but treat the first heat map as a hypothesis rather than a verdict. A hot zone near the entrance is often just people pausing to orient themselves; a cold zone at the back may simply be a layout problem that one sightline fix would solve. Change one thing, wait two full trading weeks, compare. Teams that change three things at once never learn which one worked.
One dataset for stores, online and the boardroom
Traffic analytics that lives in its own portal, separate from sales, ends up ignored. The value appears when visitors, transactions and online sales sit in the same view per location. Daells Bolighus did exactly this during its turnaround, combining in-store and online sales with visitor data across all its locations, which let management see which stores were under-performing because nobody came and which were under-performing because people came and left. Those two problems have completely different fixes, and without the combined view they look identical in a sales report.
The same logic applies outside retail. A shopping centre that pairs mall traffic with tenant sales can show a prospective anchor what the north entrance delivers per hour. A university that pairs library occupancy with timetable data can stop guessing about extended opening hours. A facility manager who pairs floor-level traffic with energy and cleaning schedules has a defensible basis for cutting both.
The retail KPIs worth reporting every week
Keep the weekly report short enough that a store manager reads it on a phone. A retail analytics platform can produce dozens of metrics; the discipline is choosing the handful that trigger an action.
- Conversion rate by hour, compared with staff on the floor in the same hour.
- Sales per visitor, which separates a basket problem from a traffic problem.
- Visitors versus the same week last year, adjusted for opening hours and public holidays.
- Zone dwell time for any area that was changed in the last month.
- Peak occupancy, for centres, airports and libraries where capacity and safety are the point.
Everything else belongs in a dashboard for the people who ask for it, not in the weekly email. Foot traffic analytics earns its budget when a number on that list changes a rota, a layout or a lease. If nothing changed in a quarter, the report is wrong or nobody is reading it.
Frequently asked questions
How to increase foot traffic in a retail store? Start by finding which hours and days are already strong and which campaigns preceded them, because your own traffic history is the most reliable test you have. Match opening hours, promotions and window displays to the demographics your counters show actually visit, rather than the audience you assumed. Then measure every change against the same weekday a few weeks earlier so you know what worked.
How to measure foot traffic in a store? Install an overhead people counter at every genuine customer entrance, configure it to exclude staff doors and out-of-hours movement, and validate it with a manual count during busy periods. Feed the counts into the same system as your sales data so visitors can be converted into conversion rate and sales per visitor. Add zone counting or journey tracking once the entrance numbers are trusted.
If your trading meetings still end with a door count and an unanswered question, we can help you map entrances properly, validate accuracy and connect traffic to the sales and occupancy numbers your teams act on. Talk to Vemco Group about store traffic analytics for your sites at vemcogroup.com/contact-us.