/global/header/smart-buildings.svg)


/global/header/facility-management.svg)






/global/header/leisure.svg)






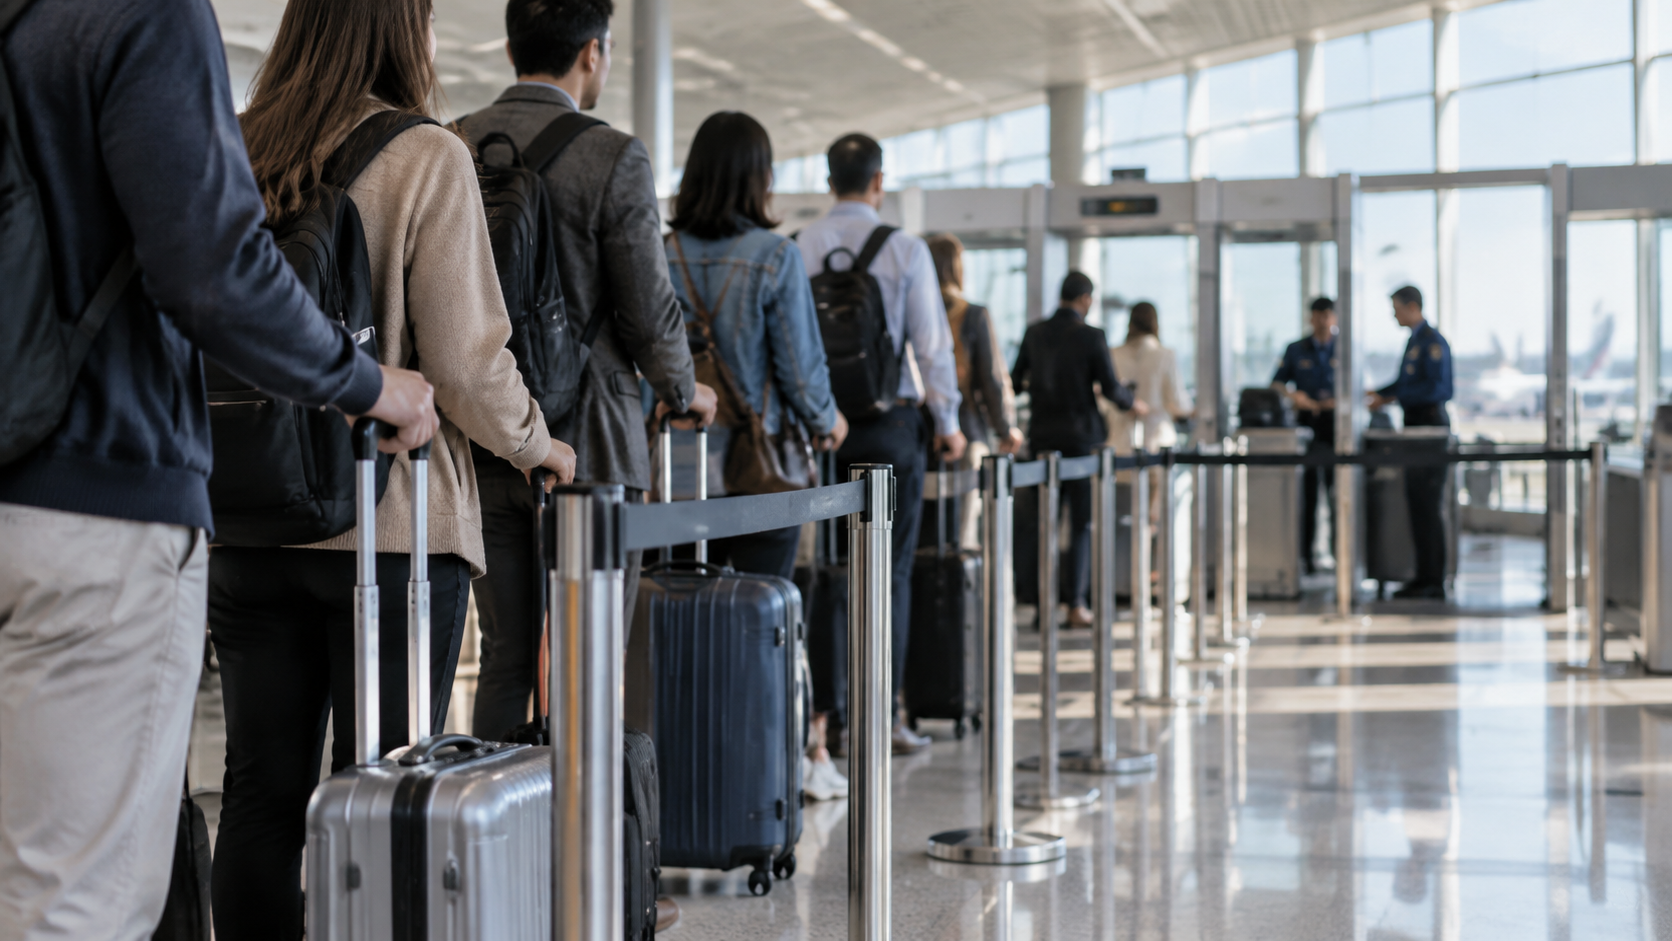
A passenger posts a photo of the security hall at 06:40 with the caption "35 minutes and counting." The duty manager pulls up the dashboard. It shows an average wait of nine minutes for the morning. Both are telling the truth. The dashboard is averaging across four hours, including the forty minutes after the first bank cleared when nobody was waiting at all. The passenger is describing the one window that actually determines whether the terminal hit its service level. This gap between what gets reported and what gets experienced is the central problem any queue management system has to solve, and most of the ones in service today do not solve it.
Averages are the wrong unit of account
Service level agreements with airlines, ground handlers and regulators are almost always written as a percentile: 95 percent of passengers processed within ten minutes, or no passenger waiting more than twenty. Yet the reporting that lands on a terminal manager's desk is usually a daily or hourly mean. The mean is flattered by quiet periods and says nothing about how long the tail was. Two terminals with identical average queue time can have completely different outcomes: one with a steady six-minute wait all morning, another with two minutes most of the time and thirty minutes during the 05:30 to 07:00 bank. Only the second one generates missed flights, compensation claims and press.
The numbers worth paying for are therefore the ones that describe the distribution, not the centre of it. At minimum, operations teams should be able to see, for every fifteen-minute slot:
- People in queue: a live headcount of everyone between the back of the line and the processing point, including any overflow outside the stanchions.
- Arrival rate: how many people join per minute, because this leading indicator moves ten to fifteen minutes before the wait does.
- Throughput per open lane: the number processed per minute, which exposes a slow lane or an unstaffed one.
- Maximum wait in the slot: the figure the SLA is actually judged on.
How queue counting replaces the stopwatch
Many hubs still measure waits by sampling: a supervisor hands a timed card to one passenger at the back of the line and collects it at the front, two or three times per peak. The method is honest but thin. Three samples cannot describe a distribution, and the supervisor is usually busy opening a lane at exactly the moment the sample would matter most. Sensor-based queue counting changes the unit from a sample to a census. Overhead sensors count every person entering and leaving the defined queue zone, and the system derives wait time continuously from the standing headcount and the exit rate. When counting accuracy is high enough, the derived wait is reliable enough to run staffing decisions on. In practice that means accuracy that is contractually guaranteed to at least 96 percent and typically lands between 98 and 99 percent when lighting, layout and passenger behaviour allow. Anything looser and the derived queue time drifts enough to lose the trust of the people who have to act on it.
Anonymity matters here too, particularly for public sector operators. Counting-based approaches do not need to identify anyone to produce a wait-time figure, which keeps the data protection assessment short and avoids the signage and consent complications that come with tracking devices or faces.
Where the measurement quietly goes wrong
Here is what anyone who has commissioned one of these systems will tell you: the queue zone drawn on the floorplan at installation almost never matches the queue three months later. Stanchion layouts get reconfigured for the summer schedule. A new fast-track lane is added and the serpentine is shortened. The overflow that used to spill left now spills right, towards the check-in desks. If the detection zone is not redrawn, the system keeps measuring the stanchions and stops seeing the fifty people standing beyond them. The dashboard then reports a comfortable wait while the hall is visibly jammed, which is precisely the failure described at the top of this article.
The practical fix is twofold. Zones should be defined generously, covering the plausible overflow footprint and not just the current barrier line, and someone on the terminal team should own a quarterly review of zone boundaries against the actual floor. Systems that show detection zones directly on the floorplan, rather than as a list of sensor IDs, make this review a ten-minute job instead of a support ticket. VemTrack takes this approach: queue detection, dwell time and zone-to-zone flow are all drawn and edited on the same floorplan the operations team already uses, so the person who moved the stanchions can also move the zone.
Turning queue time into a staffing decision
Measurement that only produces a report is a compliance tool. Measurement that produces an alert is an operations tool. The difference in budget terms is significant: a lane opened five minutes earlier because the arrival rate crossed a threshold saves more wait than any amount of post-hoc analysis. A useful queue management system lets a terminal set rules such as "alert the duty manager when people in queue exceeds 120 or projected wait exceeds eight minutes" and routes that alert to a phone, not a wall screen nobody is watching at 05:45.
The second-order benefit is commercial. Every minute a passenger stands in the security queue is a minute not spent airside. Hubs that combine queue data with downstream dwell time can show the concession team, in their own numbers, what a long morning queue costs in lost airside minutes. That tends to end the argument about whether the extra security lane is worth staffing.
Beyond the airport: service halls and interchanges
The same logic applies to a municipal citizen service centre, a licensing office or a rail interchange with ticket-gate congestion. The queues are smaller and the SLAs softer, but the measurement failure is identical: a monthly average that hides the Monday-morning tail. Facility managers in the public sector often face a harder budget conversation, because the case rests on service quality rather than revenue. Having a continuous record of wait time by hour and day, rather than complaint counts, lets a facility manager argue for a second counter at specific hours instead of a permanent extra post. Platforms built for queue management across a whole estate, from a single service hall to a terminal complex, allow a city or operator to apply one method and one reporting standard everywhere, which simplifies both procurement and audit.
Five questions to put to any vendor
- Does the system report percentile and maximum wait per time slot, or only averages?
- What counting accuracy is written into the contract, and under what conditions is it measured?
- Can our own staff redraw queue zones on the floorplan, or does every layout change require the vendor?
- How are alerts configured, who receives them, and how fast after the threshold is crossed?
- Is the data anonymous by design, and what does the data protection documentation look like?
Frequently asked questions
What is a queue management system? A queue management system measures how many people are waiting, how fast they arrive and how fast they are processed, and converts that into live and historical wait-time data. In airports and transport hubs it typically relies on overhead sensors that count anonymously, and it adds alerts so that staff can open lanes or counters before a threshold is breached. The best systems report the distribution of wait times, not just an average, because that is how service levels are judged.
If your terminal or service hall is still measuring waits with a stopwatch and a daily average, the gap between your dashboard and your passengers' experience is almost certainly wider than you think. Talk to Vemco Group about mapping your queue zones, setting percentile-based thresholds and getting wait-time alerts to the people who can act on them.