


/global/header/smart-buildings.svg)


/global/header/facility-management.svg)






/global/header/leisure.svg)





A regional manager opens the weekly sales report and sees that Store 14 is down 6% on the same week last year. The store manager says the shopping centre has been quieter. The commercial team says the autumn campaign underperformed. Finance says payroll is too high. Everyone has a theory, and nobody has the one number that settles the argument: how many people actually walked in. That gap is the reason retail traffic analytics exists, and the questions below are the ones we hear most often from teams who are deciding whether to fund it, expand it, or fix an installation that never delivered.
What does retail traffic analytics actually measure?
At its most basic, it measures entries and exits at every door, by time interval, so you know how many visitors were in the store and when. That alone changes the conversation from “sales are down” to “traffic is flat but conversion fell three points between 12:00 and 14:00 on weekdays”. A more complete retail analytics platform adds dwell time, zone occupancy, queue length, demographics and, with customer journey analytics, the paths visitors take between departments. Each layer answers a different question, so the right scope depends on who will use the data and what decisions they are trying to make.
How do we measure foot traffic without disrupting the store?
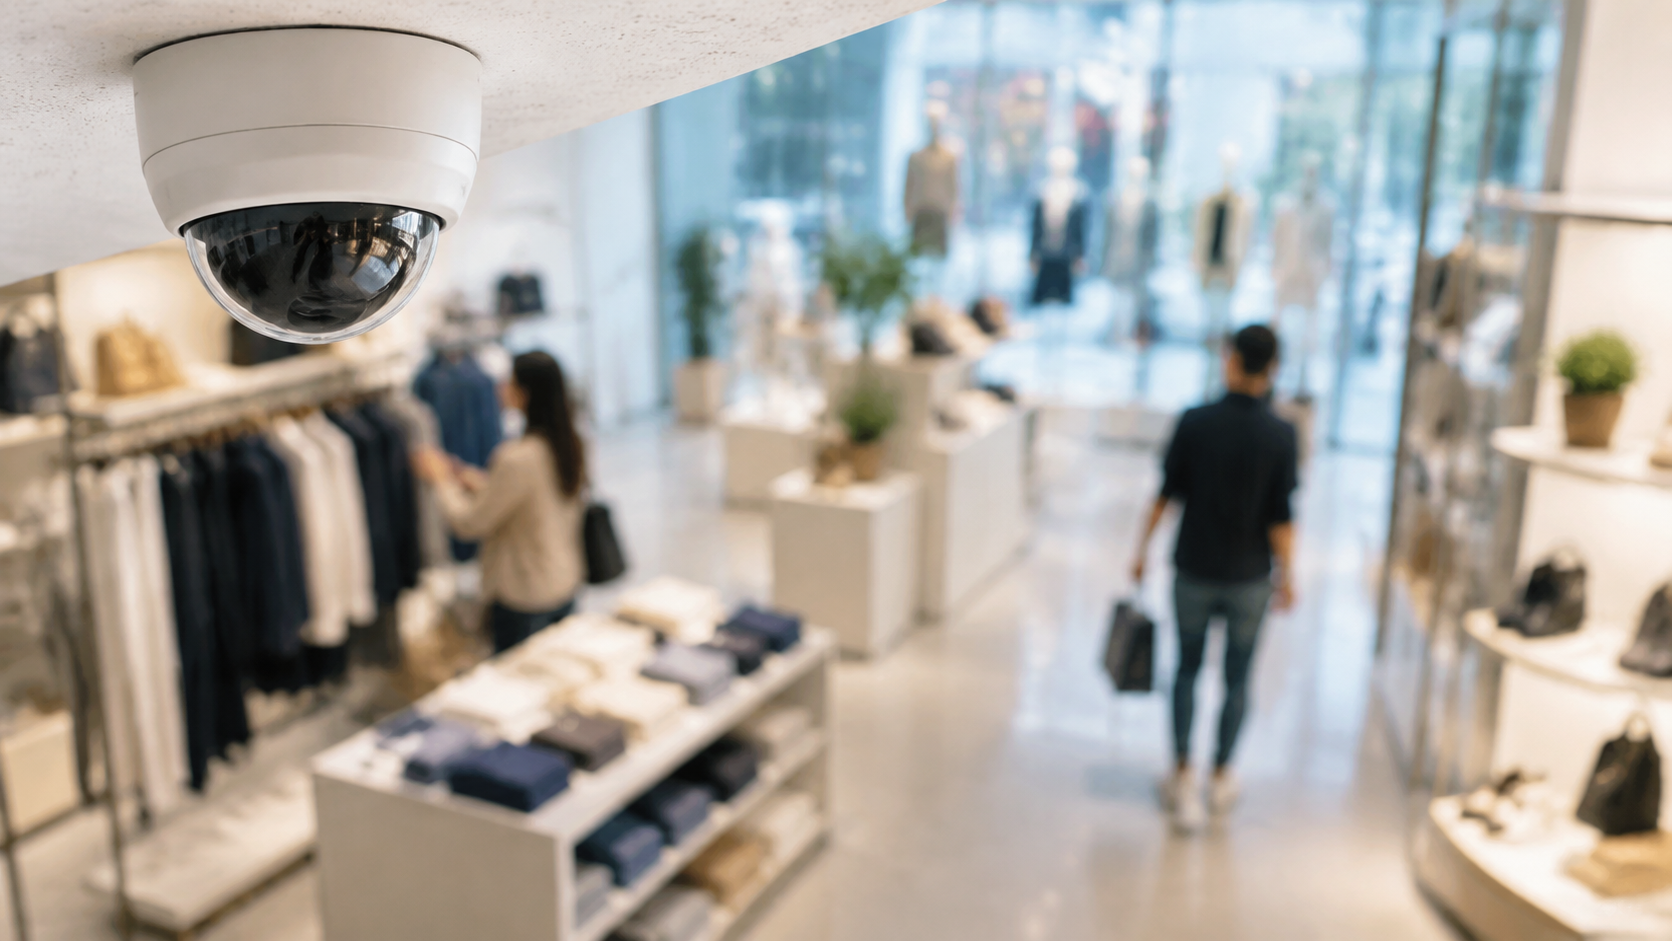
The standard approach is a ceiling-mounted retail traffic counter above each entrance, using stereo or 3D sensors to distinguish adults from children, trolleys and prams, and to count people walking side by side as two rather than one. Installation is typically a few hours per door and happens outside trading hours. The sensor sends counts to a cloud platform where they are matched against your point-of-sale data. If you operate sites in shopping centres, agree the mounting height and cabling route with the landlord early; that conversation causes more delays than the technology does.
What accuracy should we expect, and what affects it?
Be suspicious of any vendor promising a flat 99% everywhere. In Vemco’s installations the contractual minimum is 96%, and results of 98 to 99% are typical when conditions allow. The conditions that matter are lighting (strong backlight from glass frontages), layout (very wide entrances or doors that open directly onto escalators) and visitor behaviour (groups that stop in the doorway or people who loiter at the threshold). Accuracy is validated by manual counts against the sensor during audit periods, and any serious contract should state how validation is done and what happens if the minimum is not met.
A practitioner note here: in our experience, the largest errors in foot traffic data rarely come from the sensor. They come from two operational sources. First, staff using the customer entrance for breaks and deliveries, which can inflate a small store’s count by several percent a day unless a staff-exclusion rule is applied. Second, a point-of-sale clock that drifts a few minutes from the counting platform, which shifts transactions into the wrong interval and makes hourly conversion look erratic. Both are fixed in configuration, not hardware, but they must be checked at go-live.
Which retail KPIs should we track first?
Most teams start with too many. Four retail KPIs give you most of the value in the first six months:
- Conversion rate – transactions divided by visitors, by hour and by day. This is the number that separates a traffic problem from a selling problem.
- Visitors per labour hour – how many shoppers each rostered employee is expected to serve, which exposes overstaffed mornings and understaffed Saturday afternoons.
- Sales per visitor – a cleaner productivity measure than sales per square metre, because it moves with actual demand rather than with fixed floor space.
- Traffic versus centre or street benchmark – whether your store is gaining or losing share of the people who are already nearby.
One caution on conversion rate retail comparisons: the stores with the highest conversion are frequently the ones with the lowest traffic, because a quiet store serves a higher proportion of intent-driven shoppers. Rank managers on movement in their own conversion over time, not on absolute conversion against the rest of the estate.
Is real-time data worth paying for, or is a daily report enough?
For head office analysis, daily or weekly is fine. For the shop floor, real-time changes behaviour. Luksusbaby, a Danish children’s retailer, used VemCount to give store teams live conversion rates alongside visitor demographics. The practical effect is that a manager who sees conversion dropping at 15:00 can move a colleague from the stockroom to the floor while the visitors are still in the building, rather than reading about the missed sales the next morning. The demographic layer also gave marketing a check on whether the customers walking in matched the audience the campaigns were built for.
What do customer journey analytics and heat mapping add?
Door counts tell you how many came in. Journey and zone analytics tell you where they went and where they gave up. VemTrack extends counting into movement analytics using anonymous AI re-identification, so a visitor seen at the entrance can be recognised at the fitting rooms or the till without any personal data being stored. Retail heat mapping built on this shows which fixtures draw attention and which corners of the floor are effectively dead space. Commercial teams use it to price promotional bays by actual exposure rather than by guesswork, and operations teams use it to justify or reject a refit before spending on it.
How do we build the business case?
Use your own numbers. Take one store, estimate its annual visitors, its current conversion and its average transaction value. Then model a conversion improvement of half a percentage point, which is a conservative outcome from better staff alignment alone. For a store with 200,000 annual visitors and a €45 basket, half a point is roughly €45,000 in revenue. Set that against the cost of sensors and subscription and the payback period usually speaks for itself. Add labour savings from removing over-rostered hours and the case strengthens further. Present it as a pilot in five to ten representative stores with agreed success metrics, and expand from there.
Frequently asked questions
How to increase foot traffic in a retail store? Start by finding out when traffic is weakest relative to the surrounding area, because that tells you whether the problem is footfall in the location or your store’s ability to attract passers-by. Then test one variable at a time, such as window displays, opening hours or local promotions, and read the result in your foot traffic analytics rather than in anecdote. Retailers who measure this way often discover that the cheapest lever is trading hours that match when people are actually nearby.
How to measure foot traffic in a store? Install a 3D people-counting sensor above each customer entrance, configured to exclude staff and count adults, and connect it to a platform that aligns the counts with your point-of-sale data. Validate accuracy with manual counts during the first weeks and agree a contractual minimum, typically 96%, with your vendor. Once counts and sales share the same timeline, conversion, visitors per labour hour and sales per visitor follow automatically.
If your team is still debating whether Store 14 has a traffic problem or a selling problem, the fastest way to end the debate is to count. Contact Vemco Group to discuss a pilot of retail traffic analytics in a handful of your stores, with accuracy validation and KPI definitions agreed before the first sensor goes on the ceiling.