


/global/header/facility-management.svg)


/global/header/leisure.svg)


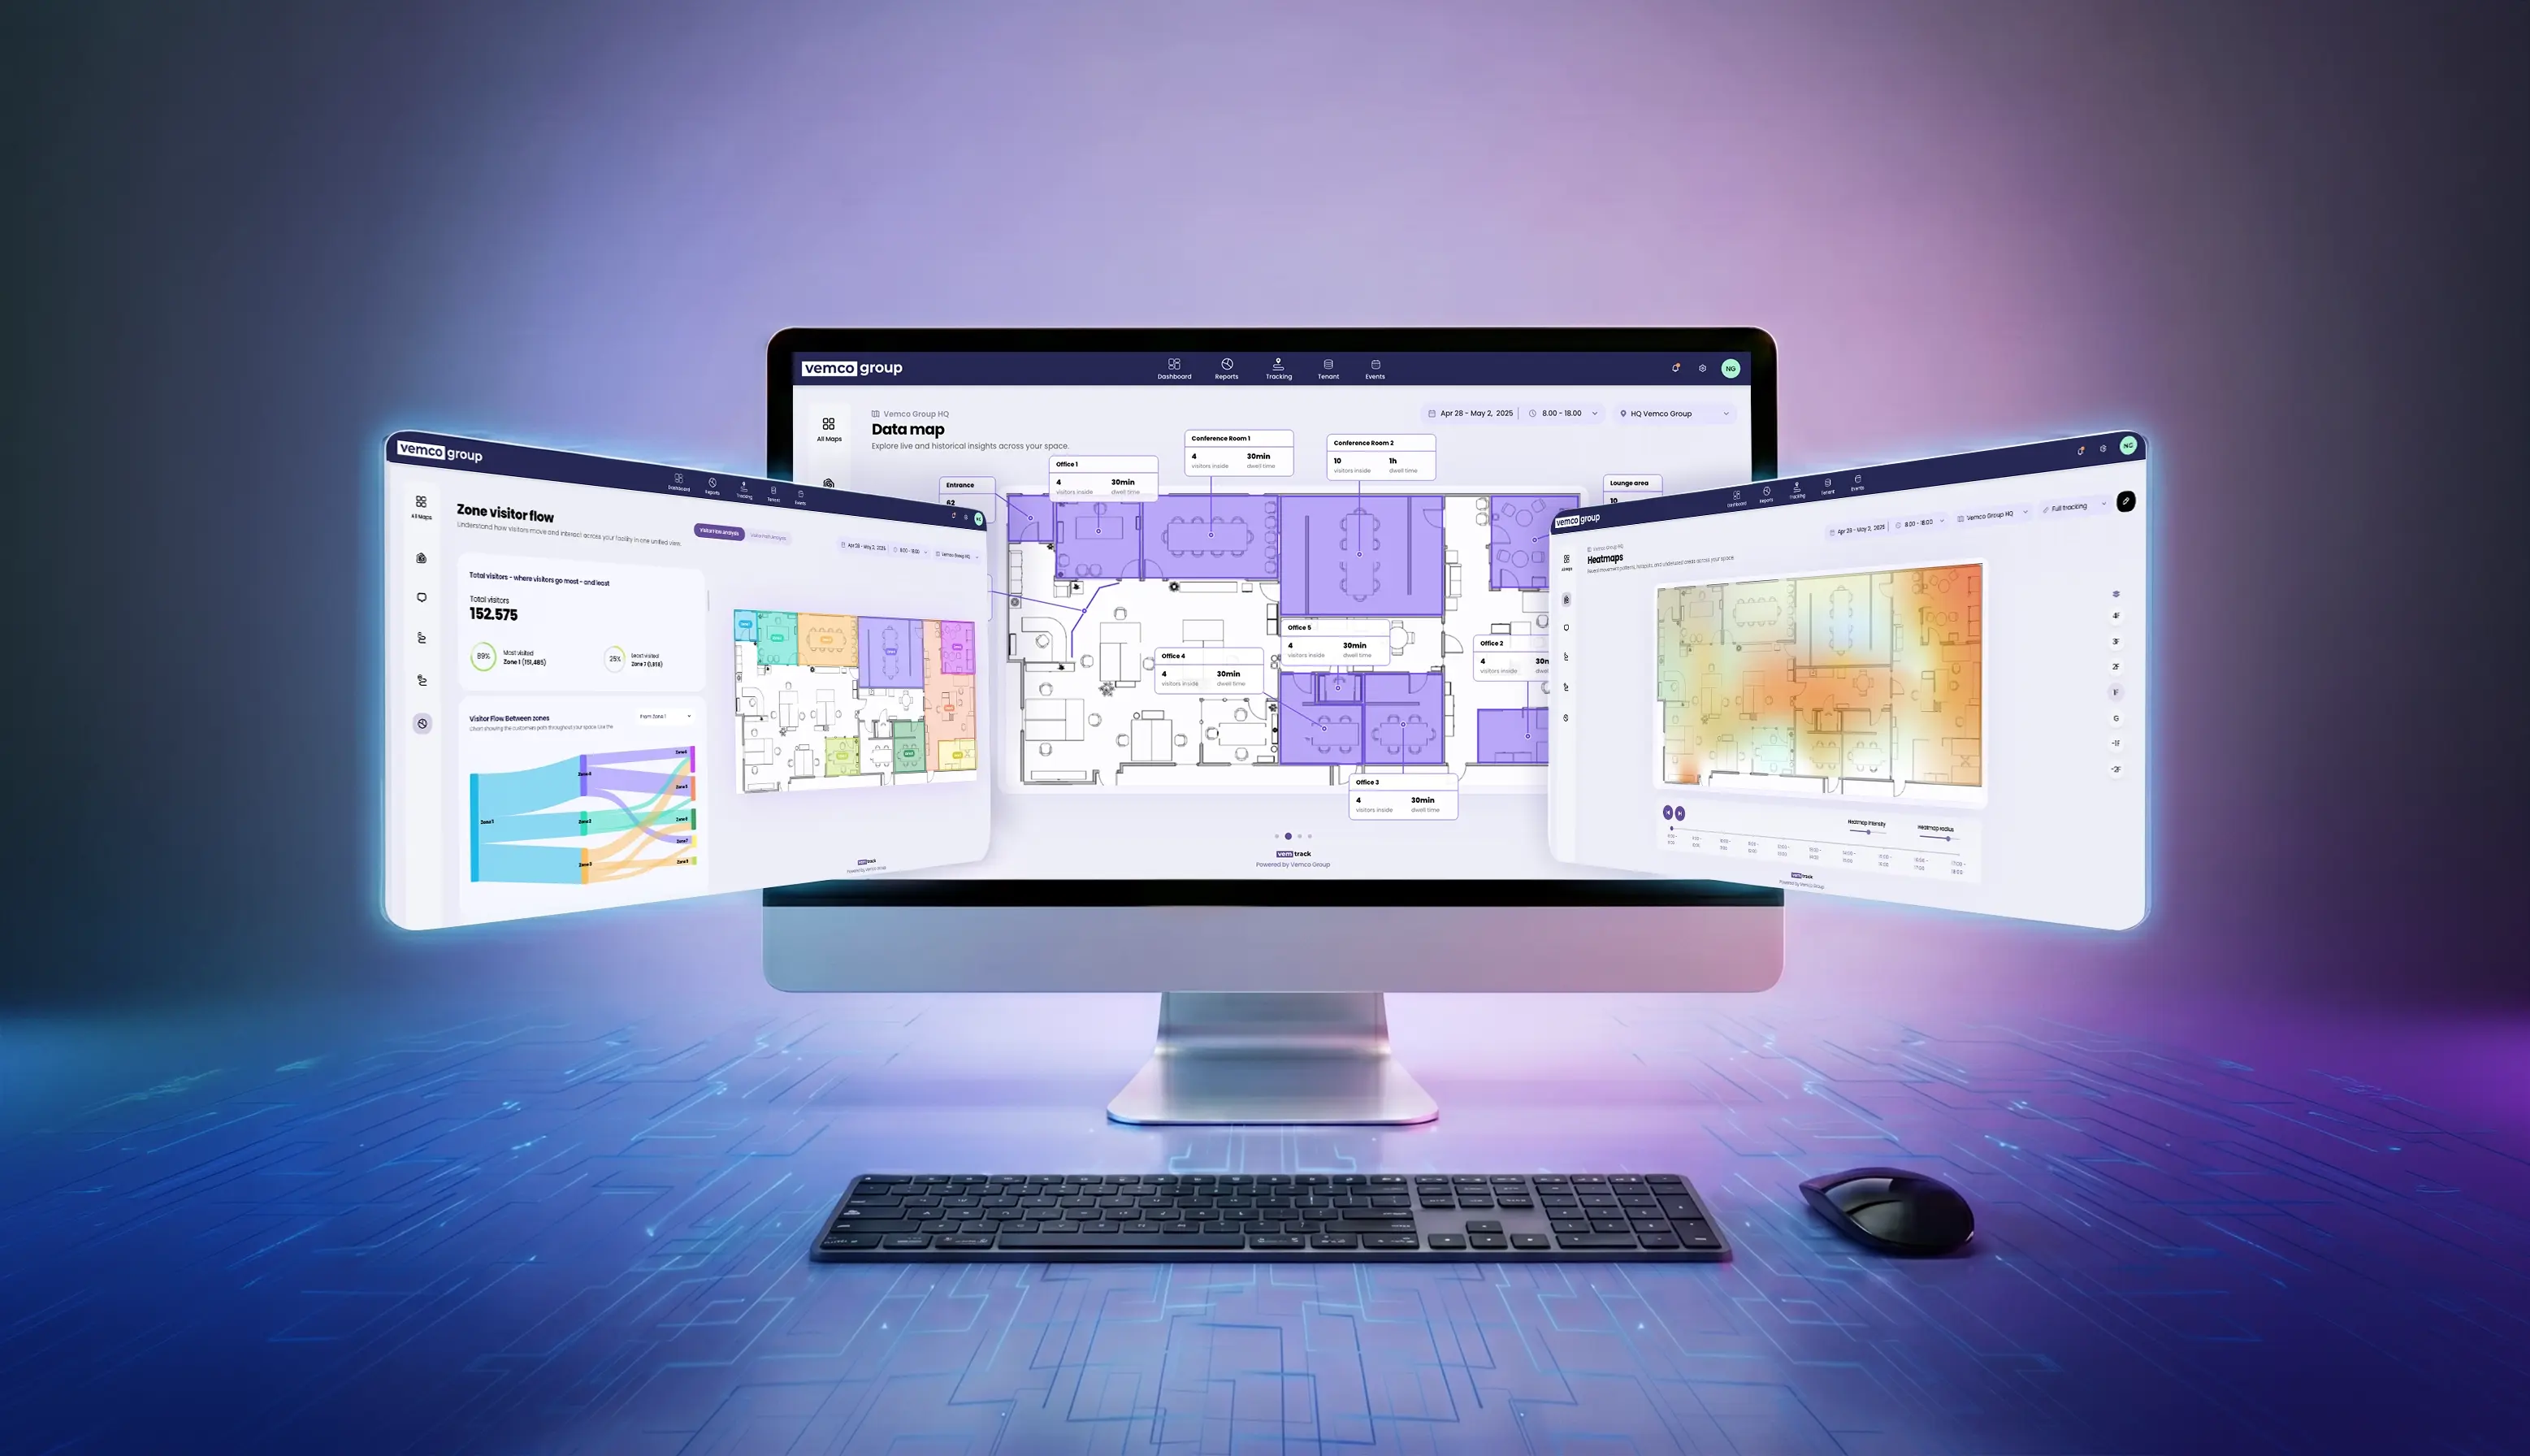
We're excited to introduce the next generation of VemTrack, our map-based analytics experience for understanding how people move through physical spaces.
Track combines floorplans, zones, sensor data, visitor journeys, heatmaps, live metrics, movement visualizations, and flow analysis into a single workspace designed to make location analytics easier to understand and act upon.
Instead of relying solely on reports and tables, Track allows users to visualize activity directly on top of their own floorplans, making it easier to identify patterns, understand visitor behavior, and optimize physical environments.
What's New in This Release?
This launch introduces several major improvements and new capabilities across the platform.
Completely Redesigned Map Editor
The map editor has been rebuilt from the ground up.
Users can now create, edit, and manage map elements more efficiently with improved drawing tools, multi-select editing, element duplication, undo/redo functionality, simplified configuration, and enhanced data source connections.
Multi-Floor Support
Track now supports locations with multiple floors.
Users can upload and manage multiple floorplans, reuse existing maps as floors, switch between levels during analysis, and create a unified view of larger locations.
Real-Time Metric Alerts
Track now includes configurable alert rules directly within the map experience.
Users can define thresholds for selected metrics and receive visual indications whenever values move above or below expected levels.
Expanded Heatmap and Tracking Analysis
Previously, Heatmaps and Tracking could only be viewed one hour at a time.
With the new Track experience, users can analyze movement and activity across entire selected periods, making long-term pattern analysis significantly easier.
Enhanced Data Visualization
Metric cards, map overlays, visual indicators, and analytics displays have all been upgraded to provide clearer insights directly within the map experience.
Analytics Workspaces
The analytics pages for journeys, flow analysis, and path analysis have been available for several months and are now fully integrated into the new Track experience, creating a single connected workspace for exploration and analysis.
Transition from Existing Maps Experiences
As part of this launch:
- Maps v1 will remain available during the transition period.
- The current Maps 2.0 experience will be discontinued and replaced by the new Track workspace which becomes the primary map-based analytics experience moving forward.
What Is VemTrack?
VemTrack is our software's dedicated workspace for visual location and tracking analytics.
It helps organizations understand how people move through stores, shopping centers, airports, public venues, workplaces, and other physical environments by connecting visitor data directly to floorplans.
Track enables users to:
- Upload and manage floorplans.
- Create measurable areas and map elements.
- Connect sensors and metrics to maps.
- Monitor live performance.
- Analyze movement patterns.
- Understand visitor journeys.
- Visualize traffic and dwell behavior.
- Identify hotspots and underutilized areas.
- Build custom visitor path analyses.
Feature Overview
Maps Directory
The Track landing page provides a central place for managing all maps.
Users can:
- Search available maps.
- Open maps directly into Track.
- Create new maps by uploading floorplans.
- Edit map names, locations, and images.
- Delete maps when no longer needed.
- View map preview cards with location context.
Floorplan and Multi-Floor Management
Track supports both single-floor and multi-floor locations.
Users can:
- Upload floorplans via drag and drop.
- Add multiple floorplans simultaneously.
- Reuse existing maps as floors.
- Rename floor labels.
- Reorder floors.
- Manage floor structures.
- Switch between floors during editing and analysis.
Map Editor
The Map Editor is where Track analytics begin.
Users can create and configure:
Zones
Area-based measurement regions used for visitor behavior and dwell analysis.
Counting Lines
Line-based measurements used for entrances, exits, and directional movement analysis.
Points
Point-based map elements for sensor locations and metric visualization.
Editor capabilities include:
- Direct drawing on floorplans
- Moving and resizing elements
- Multi-select editing
- Duplicating elements
- Deleting elements
- Undo and redo actions
- Custom color configuration
- Metric assignment
- Sensor and data source connections
- Sidebar-based element management
Sensor Data View
The Sensor Data page displays live and historical metrics directly on the map.
Users can:
- View metric cards connected to map elements
- Move and resize cards
- Show or hide selected cards
- Display connector lines
- Show zone outlines and labels
- Adjust card sizes
- Filter to active alerts only
This view is ideal for operational monitoring and rapid issue identification.
Sensor Information View
The Sensor Information page focuses on map elements and device information rather than metric monitoring.
Users can:
- Inspect configured elements
- View information cards directly on the map
- Toggle labels and outlines
- Adjust card visibility and positioning
Metric Alerts
Track now includes alert-based monitoring.
Users can:
- Create alert rules for selected elements
- Define minimum and maximum thresholds
- Enable or disable alerts
- Highlight affected map elements
- Filter maps to show active alerts only
Alerts help teams identify operational issues as they happen.
Heatmaps
Heatmaps visualize where activity is concentrated across a floorplan.
Users can:
- Identify high-activity and low-activity areas
- Move through time periods using a timeline
- Adjust heatmap intensity
- Adjust heatmap radius
- Generate heatmaps from movement paths or selected metrics
- Compare activity patterns across time periods
Heatmaps make it easy to identify hotspots, bottlenecks, and underutilized spaces.
Tracking
The Tracking page visualizes visitor movement across the map.
Users can:
- View movement paths for selected periods
- Switch between path and playback views
- Step through time intervals
- Highlight staff movement
- Exclude staff movement
- Display gender indicators where available
Tracking helps reveal how visitors move through spaces, where they stop, and how movement changes throughout the day.
User Journeys
User Journeys focuses on individual visitor behavior.
Users can:
- Browse visitor journeys
- Select visitors and view their path on the map
- View entry and exit times
- Sort by entry time, exit time, or visit duration
- Filter by dwell time
- Filter by number of zones visited
- Exclude selected zones
- Filter by entry and exit time
- Navigate between visitors
- View dwell-based map highlighting
User Journeys helps answer questions such as:
- How long did visitors stay?
- Which areas did they visit?
- Which areas did they avoid?
- What path did they take?
Visitor Flow
Visitor Flow provides a high-level view of movement between zones.
Users can view:
- Total visitors
- Most visited zone
- Least visited zone
- Flow between zones
- Zone rankings
- Longest average dwell times
- Journey matrices showing movement between areas
This provides a broader understanding of visitor behavior across an entire location.
Visitor Path Analysis
Visitor Path Analysis allows users to build custom visitor funnels.
Users can:
- Select a start zone
- Add additional zones
- Build custom visitor paths
- View funnel-style conversion results
- Switch between funnel and map views
- Save and reuse path configurations
This makes it possible to understand how visitors progress through important areas and where drop-offs occur.
One Connected Analytics Workspace
Track is designed as a single connected workspace rather than a collection of separate tools.
Key highlights include:
- Floorplan-first analytics
- Map-based metric cards
- Configurable zones, lines, and points
- Multi-floor support
- Live and historical data views
- Real-time alerts
- Visual heatmaps
- Movement tracking
- Visitor journey analysis
- Visitor flow analytics
- Custom path analysis
- Consistent map controls across all pages
By bringing maps, sensors, analytics, and visitor behavior together in one visual environment, Track helps organizations turn location data into actionable insights faster than ever before.
Want to join the fun? Get a free consultation regarding your business needs and see how VemTrack can elevate your operations and boost sales. Book your demo today.

.jpeg?width=352&name=Image%20(73).jpeg)
