/global/header/facility-management.svg)


/global/header/leisure.svg)


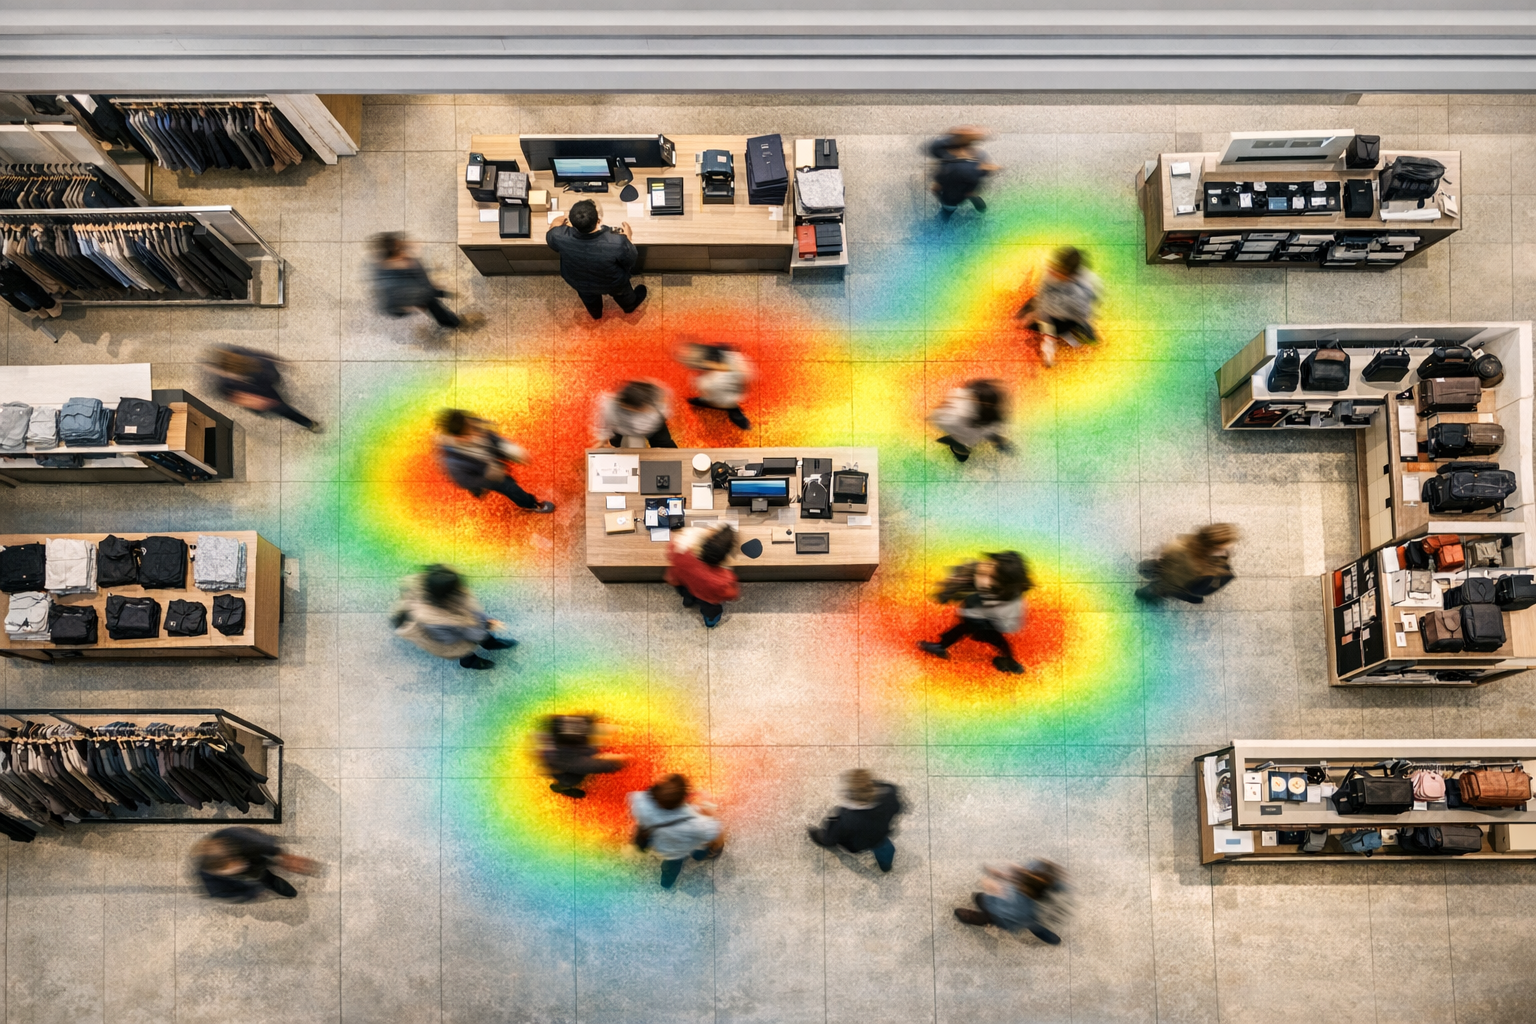
Most store layouts are designed around where merchandisers think people go, not where they actually go. The two are rarely the same. A designer positions a hero display at the front-right power wall because that is the classic rule — yet the data often shows shoppers cutting diagonally toward the back-left, drawn by lighting or a sightline nobody planned. This gap between intended flow and real flow is exactly where AI analytics improve store layout design: they replace assumption with counted behaviour.
Start with the door, not the display
Before you move a single fixture, you need to know how many people entered and what they did next. Vemco Group has been building people-counting and retail-analytics software since 2005, and the systems now process more than 85 million counts per day across 2,000+ customers. The number that matters most for layout work is not footfall alone — it is the ratio between people who enter and people who reach a given zone. If 100 shoppers walk in and only 12 reach your seasonal wall, that wall has a placement problem, not a product problem.
Accurate baselines depend on excluding your own staff from the count. Employees walking the floor, restocking, and standing at tills inflate every zone unless the algorithm removes them. Vemco's staff-exclusion handles this automatically, which keeps your dwell and conversion figures honest.
Reading the floor as zones, not a single number
A store total tells you almost nothing about layout. Break the floor into zones and the picture sharpens. With VemCount and VemSpace, you can see:
- Capture rate — the share of entering shoppers who actually walk into a department.
- Dwell time — how long they stay, which separates a browse from a genuine consideration.
- Zone-to-till conversion — whether time spent in an area turns into sales.
- Dead zones — corners and aisles that consistently under-perform against the space they occupy.
A high-dwell, low-conversion zone is the most common finding — and the most useful. It usually means the product is interesting enough to stop people but the adjacencies, pricing signage, or stock levels are failing them. That is a merchandising fix, not a relocation.
Who is actually in front of the fixture
Layout decisions improve when you know who reaches each area. Vemco's AI sensors can detect age and gender and separate children from adults. For a designer, that changes practical choices: shelf heights for a department skewing older, pushchair-width aisles where family groups cluster, or the realisation that a section built for one demographic is being used by another. The sensor layer is device-independent and sensor-agnostic, working with 3D AI units from Xovis as well as Milesight, Hikvision, and AXIS — so you are not locked into replacing hardware you already own.
A practitioner note on accuracy and mounting
Here is something you only learn after a few installations: sensor position quietly decides how much you can trust your zone data. Vemco's contractual minimum accuracy is 96%, and in practice counts typically land at 98–99% when lighting, store layout, and visitor behaviour allow. That last clause is not marketing hedging — it is real. A sensor mounted over a glass entrance with strong afternoon backlight, or one covering an aisle where people cluster in tight groups, will sit at the lower end of that range. Before you redesign a department based on its numbers, confirm the coverage over that zone is clean. Two hours checking mounting angles at install saves you from redrawing a floor plan on bad data six months later.
Testing a layout change instead of guessing at it
The real value shows up when you treat a layout change as an experiment with a before and after. Move the fixture, hold everything else steady, and compare two weeks of zone data against the previous two. Because VemFusion ties traffic to transaction data and VemCount feeds into your ERP and BI tools, you can see whether the new placement lifted conversion or just moved traffic around without adding revenue. Both outcomes are worth knowing.
A worked example: a shoe retailer noticed a strong-dwell zone near the entrance that converted poorly. The data showed shoppers stopping to look but leaving before reaching the fitting area at the back. They shifted the fitting stations one bay closer and added a clear sightline. Capture into the back half of the store rose, and the entrance zone's conversion climbed with it — because people who tried on were the ones who bought. No new stock, no new staff, just a floor plan corrected by watching what people already did.
For multi-site and landlord teams
Chains benefit from comparing the same layout across stores. A planogram that performs in a high-street unit may fail in a mall unit with different entry patterns. VemTrack and VemTenant let you benchmark those differences instead of forcing one template everywhere. Landlords and shopping-centre operators use the tenant-level view to place high-draw stores where they pull traffic past weaker units — layout thinking applied to a whole building rather than a single floor. Vemco supports this hosted or in a private cloud, with partners across more than 95 countries and R&D run from the Fredericia headquarters in Denmark.
The stores that get layout right are not the ones with the biggest design budgets — they are the ones that measure, adjust, and measure again. If you want to see where your shoppers actually walk and what your current floor plan is costing you, talk to the Vemco Group team about setting up zone-level analytics for your store or portfolio.