/global/header/facility-management.svg)


/global/header/leisure.svg)


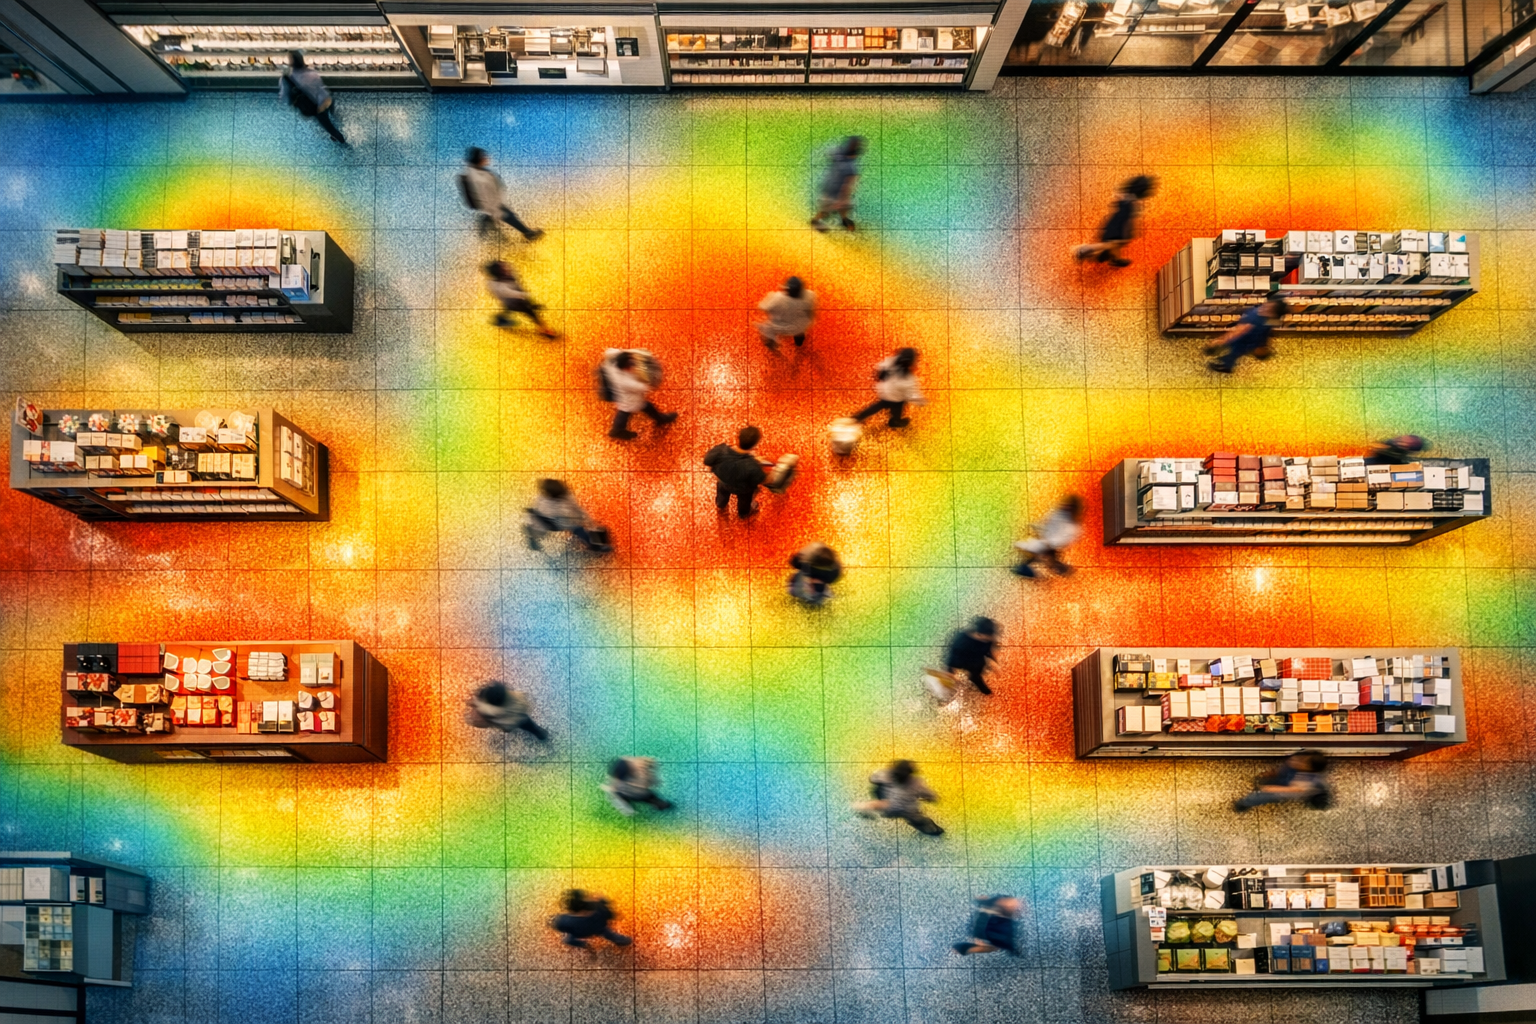
The most expensive square metre in most stores is the one right inside the front door — and it's frequently the least productive. Shoppers walk through it without slowing down, eyes still adjusting, hands still on their phones. Merchandisers keep loading that zone with promotional displays because it feels prominent. A heatmap tells a different story: the first four to five metres of a store are a decompression zone where almost nothing registers. That single insight, visible in a colour gradient rather than a spreadsheet, is why heatmaps have become a decision tool rather than a curiosity.
What the colours are actually measuring
A heatmap aggregates dwell time and movement density across your floor. Warm areas mean people stop and linger; cool areas mean they pass through or avoid entirely. On its own, that's descriptive. The value comes when you overlay it with sales data by fixture, staffing levels, and the specific merchandising decisions you made that week. Suddenly a "cold" corner isn't just underperforming — you can see whether the problem is a sightline blocked by a tall gondola, a category that doesn't belong there, or simply a spot no traffic route leads to.
Vemco has been building this kind of measurement since 2005, and today processes more than 85 million counts per day across 2,000+ customers. That volume matters for one practical reason: heatmap conclusions are only as trustworthy as the counting underneath them. Vemco's contractual minimum accuracy is 96%, and typically reaches 98–99% when lighting, layout and visitor behaviour cooperate. If your counts drift, your heat gradients drift with them, and you start optimising against noise.
The opportunities hiding in the cold spots
Retail directors tend to ask heatmaps to prove where the traffic is. The sharper question is why certain areas stay cold when the product in them is strong. A few patterns recur across stores:
- Right-turn bias. In most Western markets shoppers drift right on entry. If your highest-margin category sits to the left, the heatmap will show it starved of attention regardless of how well it's merchandised.
- The back-wall gap. Traffic often reaches the perimeter but never penetrates the middle of the floor. Cool centre aisles usually mean your layout offers no reason to cross them — no anchor, no visual pull.
- False hot spots. A warm area near fitting rooms or checkout can look like engagement but is really queuing. Dwell time without conversion is congestion, not interest, and it can actively push people out.
Each of these is a testable hypothesis. Move the anchor category, reposition a fixture to open a sightline, or relocate a promotion out of the decompression zone — then read the heatmap again two weeks later against the same weekday traffic. This is where heatmaps stop being wall art and start driving layout budgets.
From movement to journey
A static heatmap shows where people ended up. It doesn't show how they got there, and that distinction is where a lot of merchandising decisions go wrong. VemTrack adds customer-journey and movement analytics, including AI Re-Identification, so you can follow the actual paths shoppers take rather than inferring them from heat blobs. That reveals sequence: which display a customer saw first, whether they doubled back, where they abandoned a route entirely.
A practitioner's note here, learned the hard way: run your first heatmap read before you tell store staff you're measuring anything. The moment associates know a zone is being watched, they gravitate toward it, straighten it, and engage more customers there — and your baseline is contaminated. Capture a quiet week first, then introduce the changes you want to test.
Pairing heat with who is actually in the store
A heatmap answers "where," but decisions improve dramatically when you can also answer "who." Demographic targeting matches your marketing and merchandising to the real age and gender profile of your visitors rather than the profile you assume you have. Luksusbaby used VemCount to watch real-time hit and conversion rates alongside visitor demographics — meaning the team could see not only which parts of the store drew attention, but whether the people drawn there matched the product's intended buyer.
That combination changes the conversation with visual merchandising. A cold zone in front of a premium display isn't automatically a bad location — it may be that the visitors passing it aren't the target demographic at all, and the fix is scheduling or assortment rather than fixtures.
Making it a management habit, not a one-off audit
The retailers who get the most from heatmaps treat them as a recurring rhythm tied to real numbers. When Daells Bolighus worked through a turnaround, the useful step wasn't a single report — it was integrating in-store and online sales and visitor data across locations, so heat patterns in one store could be read against sales and traffic everywhere else. That's how you tell whether a cold aisle is a local layout problem or a chain-wide assortment issue.
For store managers, the practical cadence looks like this:
- Read heat against conversion, not raw footfall — warmth without transactions is a warning, not a win.
- Compare like weekdays to control for traffic swings before crediting or blaming a layout change.
- Give visual merchandising one hypothesis to test per cycle, not five, so cause and effect stay legible.
- Feed the wins upward, so a fixture change that lifts a cold zone in one store becomes a template others can adopt.
Heatmaps don't hand you answers. They tell you exactly where to look, which is worth far more than another dashboard of totals. The hidden opportunity in most stores isn't a missing product — it's a well-stocked area shoppers never reach, and a heatmap is the fastest way to find it.
See your own floor in colour
If you want to know which square metres of your stores are quietly costing you sales, start with a heatmap read tied to your actual conversion and demographic data. Talk to the Vemco team about mapping movement, dwell and journeys across your locations — and turning cold zones into measurable revenue.